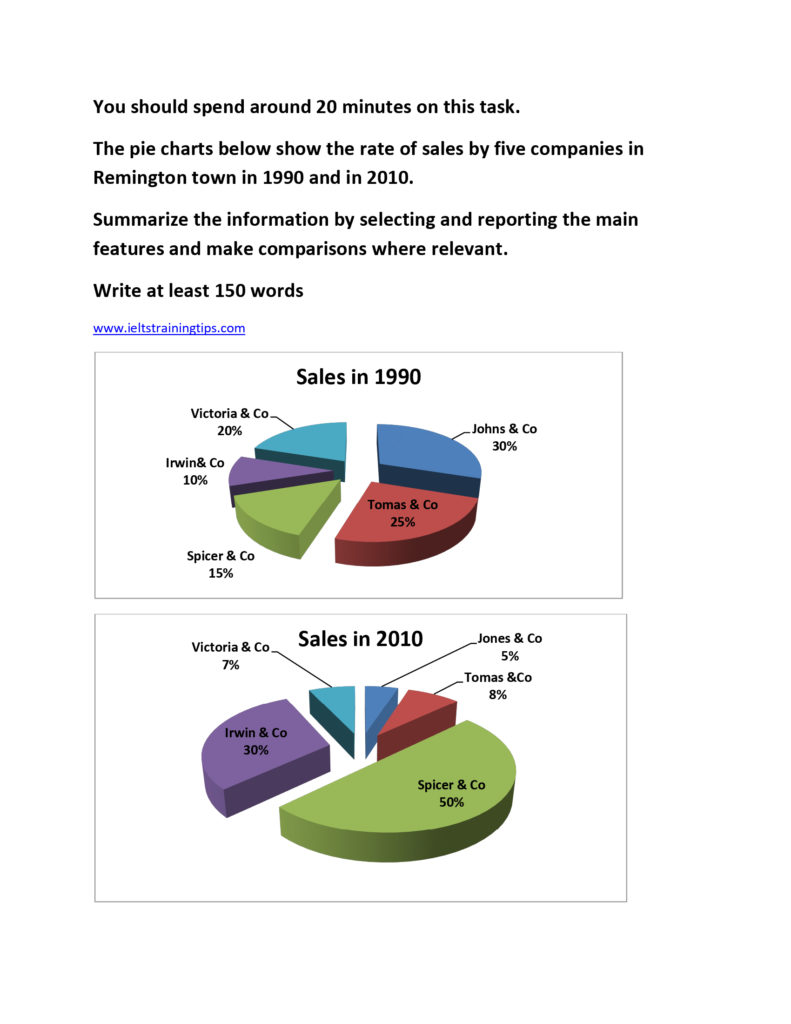
A clear cut comparison of the rate of sales by five companies in Remington town in two different years( 1990 and 2010) is illustrated in the given pie charts.
As per the chart,all the five companies experienced significant variations in terms of their proportion of sales in these years. The widest variation is seen in case of Spicer &Co, with a progressive sales percentage of nearly half of the total sales in 2010, compared to a negative sales of 35% in 1990. The next positive fluctuation in the rate of sales was exhibited by Irwin & Co, which was 15% less than that of the Spicer’s.
However, among those companies which suffered a setback in their sales in the latter year, Johns $ Co experienced the worst. It’s rate of deficit sale was approximately 25. The other two companies which had lost their customers were Tomas & Co and Victoria & Co, with a lower percentage ranged between 13 and 17.
Overall, it is clear, between these years, Spicer & Co made the most gain, while Jones & Co suffered the most loss in sales.