MODEL ANSWER:
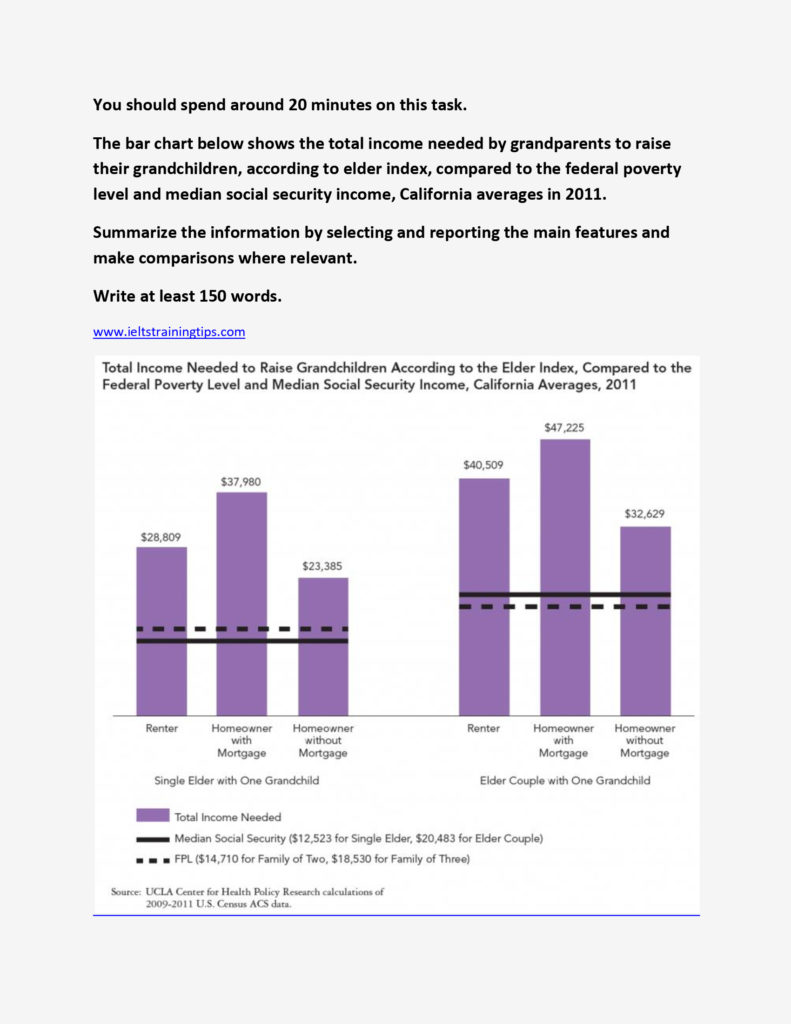
The aggregate income needed by the grandparents to raise their grand children in California, in comparison with Federal Poverty Level and Median Social Security income in 2011 is depicted in the given bar graph.
As can be seen in the chart, both single elders and elder couples with a grandchild, who lived in their house with mortgage, had to spend the maximum compared to those who had no mortgage and those who lived in rented houses. The average Median Social Security is lower than the average Federal Poverty Level in case of the former (over $2000), whereas it is almost the opposite in case of the latter. The total income needed by a single grandparent in a rented house was $9171 less than those who live in their own house with mortgage, whereas, those who did not have any mortgage spent $14595 less. However, in case of elder couples who rented a house spent $2455 less than their single counterparts, whereas the amount spent was almost the same for both single and couples who had no mortgage.
Overall, it is clear that though the elderly couples had to spend more on the grandchildren raising, the liability was more on single grandparents.
Word count:196