MODEL ANSWER:
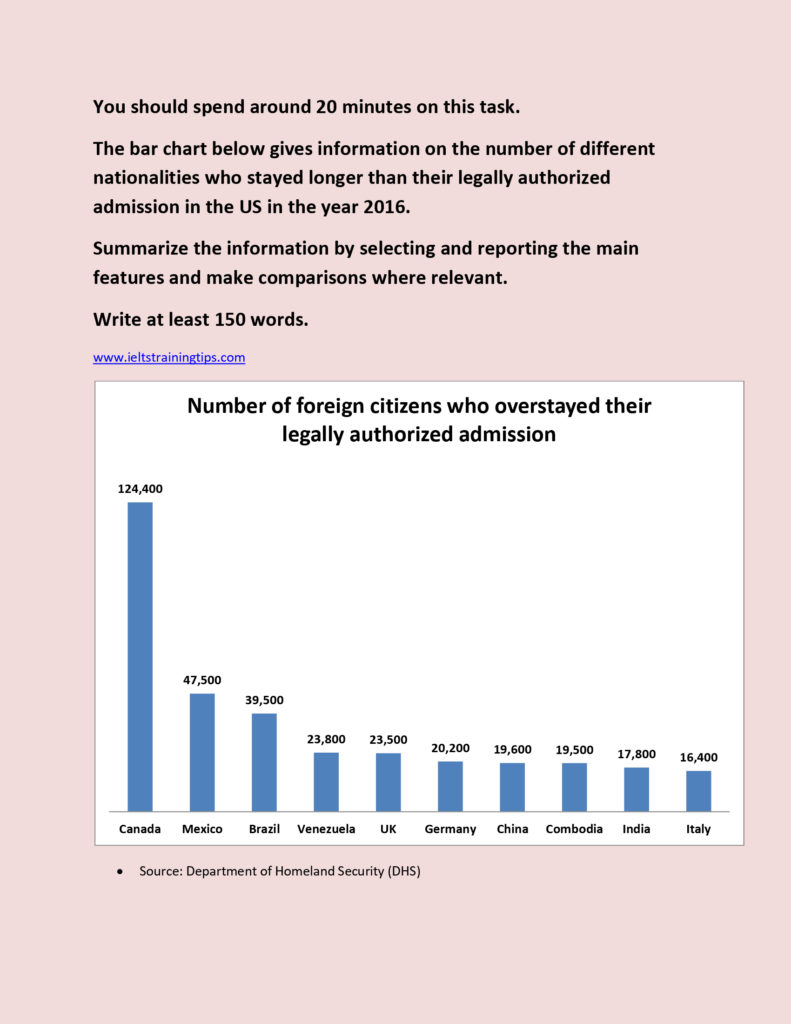
The illegal stay of different nationalities in the US in 2016 after their entry to the country is depicted in the bar chart.
As per the chart, Canadians stood at the top in case of the stay(1,24,400). Their number was far more than any other nationalities. It was 79,500 more than the Mexicans’ and 84,900 more than the Brazilians’. The number of the UK nationals and Venezuelan nationals who stayed longer in America was almost similar over the period. Here the Venezuelan number was 300 more than the UK’s (23,500). Chinese and the Cambodian nationals also had a similar pattern and here, the variance is just 100 in number. However, a wider disparity is seen in the number of Germans and Indians who made a longer stay in the US. This was 20,200 and 17,800 respectively. Of the given nationalities, only 16,400 Italians overstayed their legally authorized admission in 2016.
Overall, it is understand that a considerable proportion of different nationalities overstayed in the US in given year with an exceptional Canadian population.
Word count:163