MODEL ANSWER:
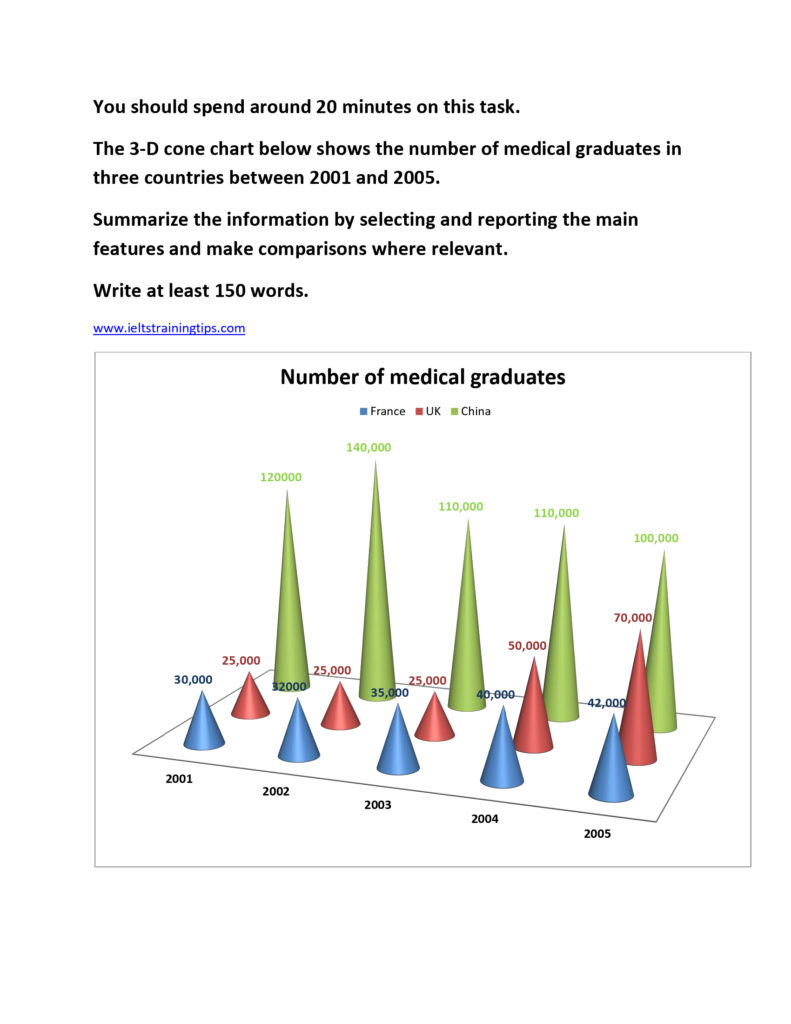
The fluctuations in the annual census of students who graduated in Medicine from 2001 to 2005 are depicted in the given chart.
As per the chart, the cones representing China are seen exceptional all through the period. The highest number of medical graduates produced by China was 0.14 million, in the year 2002. This was 20,000 more when compared to the figure of the previous year. Compared to the other two countries, (The UK and France), these figures showed a wide discrepancy in both the years. Between these years, they could produce only around 25,000 to 32,000 medical graduates respectively. In 2003, France made a progress in the volume by adding 3,000 to its previous figure, whereas China lost 30,000. Though their number in the UK remained unchanged that year, in the consecutive years, the country made a leap, by doubling it in the next year and almost tripling it by 2005. The progress was not so significant in case of France, when it could produce only 42,000 medical graduates by this time. By contrast, China had a declining trend in these years when its number touched an all time low of 1, 00,000 in 2005.
Overall, it is clear that when the preference to Medicine rose in both the UK and France, in China, it was declining over the given period.
Word count: 207