


You should spend about 20 minutes on this task.
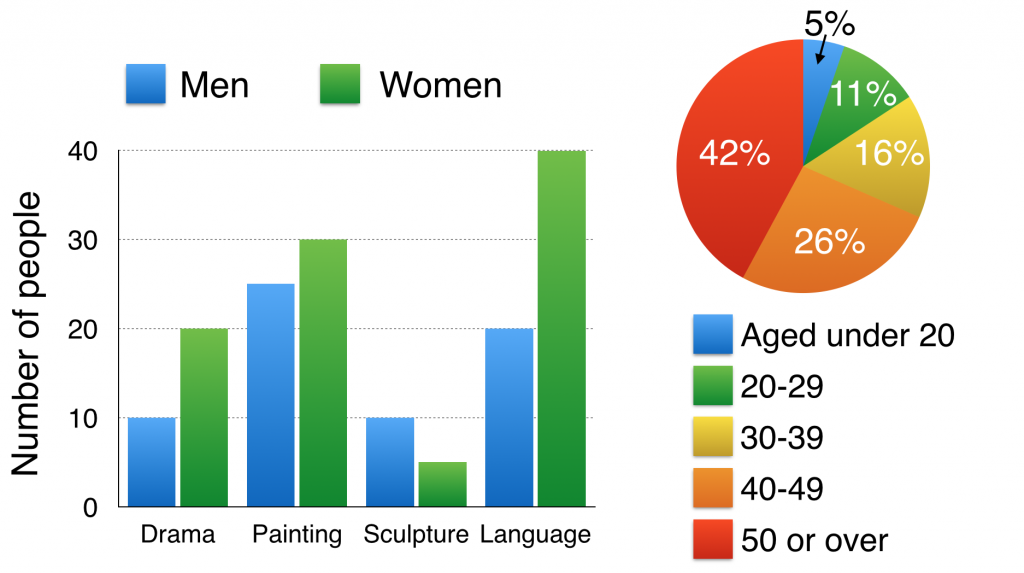
The bar chart below shows the numbers of men and women attending various evening courses at an adult education centre in the year 2009. The pie chart gives information about the ages of these course participants.
Summarize the information by selecting and reporting the main features and make comparisons where relevant.
Write at least 150 words.
MODEL ANSWER>>>
Data regarding the volume and age of the members of an evening batch in an adult education centre in 2009 is portrayed in the given charts.
Overall, it is clear that majority of the students were older and the most attendance was recorded for language lessons, specifically from the female gender.
Turning to the attendance status, women dominated in majority of the courses except in sculpture. Language lessons, in which most enrolment was recorded, out of 60, 40 were women. Painting, the second preferred evening course had 30 female students when compared to 25 male students. When in the drama it was 20:10, the figures in case of sculpture differed. Here, the attendance of men was double than that of women(10:5).
As per the pie chart, it is evident that most members of this education centre were over 40. This accounted for about 68% of the total, in which 42% were over 50. Almost a sixth of the total was between 30 and 39, while just over a tenth were between 20 and 29. Only a mere 5% of students were under 20.
Word count: 167