


You should spend about 20 minutes on this task.
The bar chart below shows the percentage participation of men in senior development in three companies between 1980 and the year 2010.
Summarise the information by selecting and report in the main features, and make comparisons where relevant.
Write at least 150 words
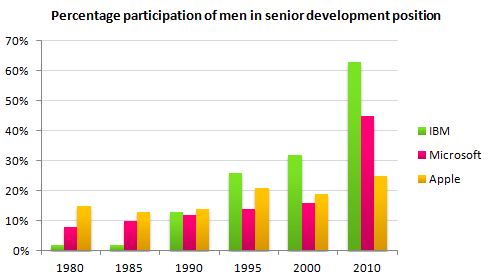
A comparison on the rate of participation of men in senior development in three firms between 1980 and 2010 is picturized in the given bar chart.
In general, the participation rate of men grew in all three companies, though the pattern was uneven.
As per the chart, Apple was the firm which employed more men in the post of senior development from 1980 till 1990, and this was around 15%. In the first five years, the rate of participation was the least in IBM (2-3%), however after that, it started climbing till the end of the period. The growth rate was almost 10% every five years between 1985 and 1995. The rate expanded further by 30% in the last decade to reach around 63 in 2010.
The hike in the participation rate in Microsoft was uniform till 2000 from approximately 8 to 15. However, it leapt to 45 in the next 10 years. Despite a small dip in 2000, to under 20, the proportion of men who employed in senior development in Apple grew to 25 by 2010 from nearly 13 in 1990.
Word count:160