


You should spend about 20 minutes on this task.
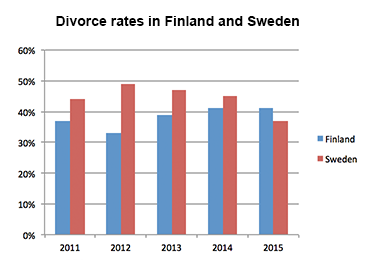
The bar chart shows the divorce rates in two European countries from 2011 to 2015.
Summarise the information by selecting and reporting the main features, and make comparisons where relevant.
Write at least 150 words.
MODEL ANSWER>>>
A clear cut comparison of the divorce rates between Finland and Sweden over a period of five years from 2011 is depicted in the given bar graph.
Overall, it is clear that the general trend of divorce was declining in Sweden, whereas this was fluctuating in Finland.
As per the bar chart, the Swedes had more divorces than the Finns over the period, except in 2015. In 2011, out of the total marriages in Sweden, around 44% ended up in divorce, whereas this rate was almost a 6% lesser in Finland.
However, in the next year, the rates diverged in both countries. When the proportion of divorced grew to almost 50 in Sweden, which was the highest over the period, it fell to nearly 33% in Finland.
Between 2013 and 2015, there was a gradual declining trend in the rate of divorces in Sweden, and this was from 47% to 37%. During the same period, the figures in Finland hovered around 40%.
Word count: 150