MODEL ANSWER:
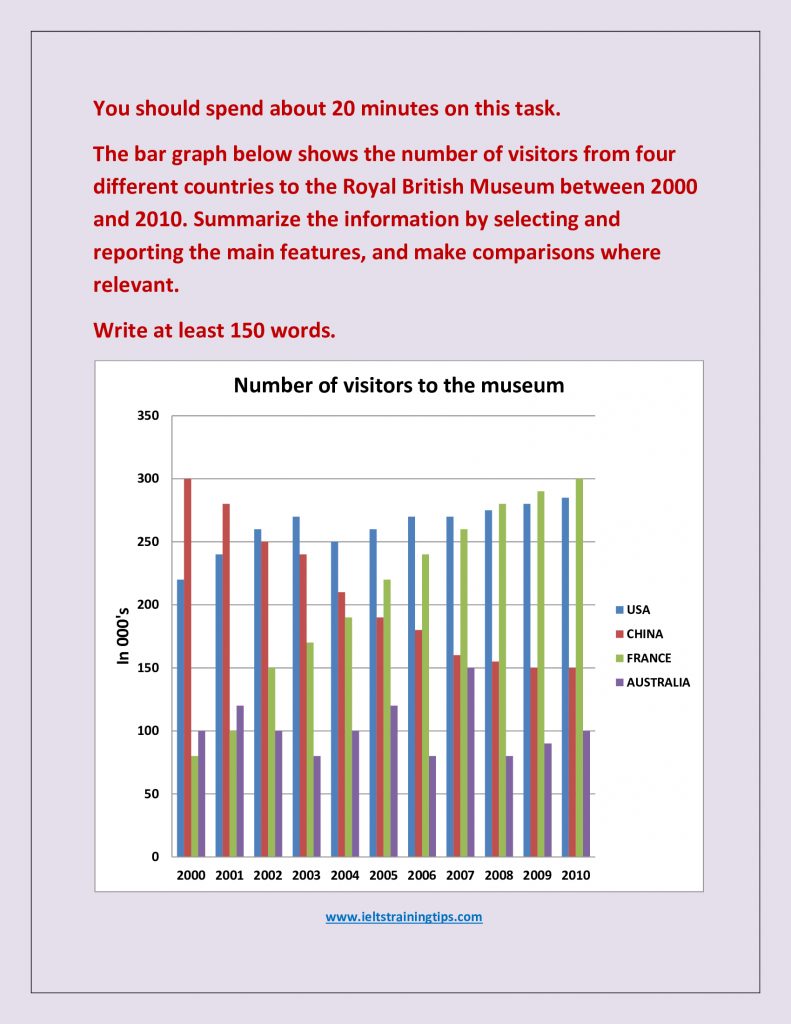
The bar graph illustrates the footfall of tourists to the Royal British Museum from four different countries (USA, China, France and Australia) from 2000 to 2010.
Overall, most number of visitors were the Chinese at the beginning of the decade, whereas the French took their place by the end of decade. The number of American visitors was high throughout, meanwhile the Australian tourists had a lower turnout when compared to other nationals.
In 2000, the number of Chinese visitors to museum was 300,000, but it decreased at a continuous pace till 2009 to reach 150,000. The same number of people visited in 2010 as well. On the other hand, an increasing trend is observed in the number of French visitors. Their number was just 75,000 back in 2000, but got quadrupled in 2010.
A significant proportion of Americans visited the museum during this period. From 2002 to 2007, the American visitors’ volume was the highest among all and their average footfall was between 250,000 to 270,000.
Australians, on the other hand, reported a relatively less number of visitors(between 50,000 and 150,000), and their highest ever visitor number was in 2007.
Word count: 173
Courtesy: Mr. Saurabh Kumar