


You should spend about 20 minutes on this task.
The chart below gives information about “Istanbul Promo plus” sales in 2007. Summarise the information by selecting and reporting the main features, and make comparisons where relevant.
Write at least 150 words.
MODEL ANSWER>>>
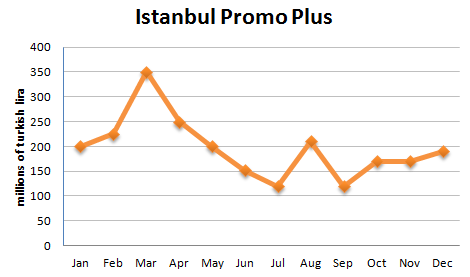
Information on the sales named ‘Istanbul Promo Plus’ in Turkey throughout the year of 2007 is depicted in the given line graph.
Overall, it is clear that though the sales progressed in the initial months, it could not maintain the momentum in the rest of the months.
In January, the Promo Plus fetched a sale of 200 million liras, which then turned out to be positive in just a month. The sales then shot up to 350 million liras, which was the highest in 2007. However, during the next four months there was a negative growth in the sales, and by July, it hit the first recorded minimum sales (just over 100 million liras).
Although the sales appeared to revive in August, when it just crossed 200 million mark, it fell back in the very next month. During the rest of the months, the sales grew back gradually, and by December, it hit back to nearly 200 million liras.
Word count: 152