You should spend about 20 minutes on this task.
The chart below shows the places visited by different people living in Canada.
Summarise the information by selecting and reporting the main features, and make comparisons where relevant.
Write at least 150 words.
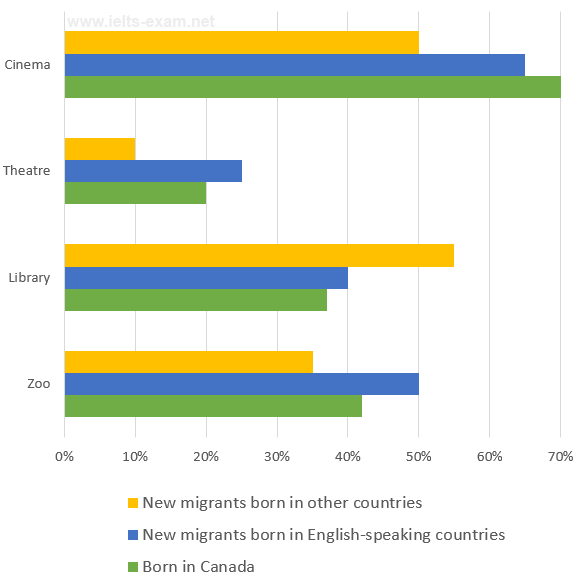
Information on different visits made by Canadian citizens, divided by their places of origin is depicted in the given bar chart.
In general, most visits to these places are made by new migrants born in English-speaking countries, and cinema is the favourite place for all three types of citizens.
As per the chart, most native Canadians go to cinema, and this accounts to nearly 70% of their total population. The top most visits by new migrants from English-speaking countries are also to this place (65%), whereas it is just 50% in case of migrants from other countries.
Library is the place where most new migrants from non-English speaking countries visited, with around 55% of their total. Visits by the other two categories of citizens here falls between 35 and 40%.
The rate of visits to zoos ranges between 35 and 50%, in which the most constitutes new migrants born in English-speaking countries. This is almost 7% more than the native Canadians and 15% more than the other group.
The maximum attendance to the theatre is from the citizens from English-speaking countries, which is just 25%. The other two groups also has the least attendance here.
Word count: 184