MODEL ANSWER>>>
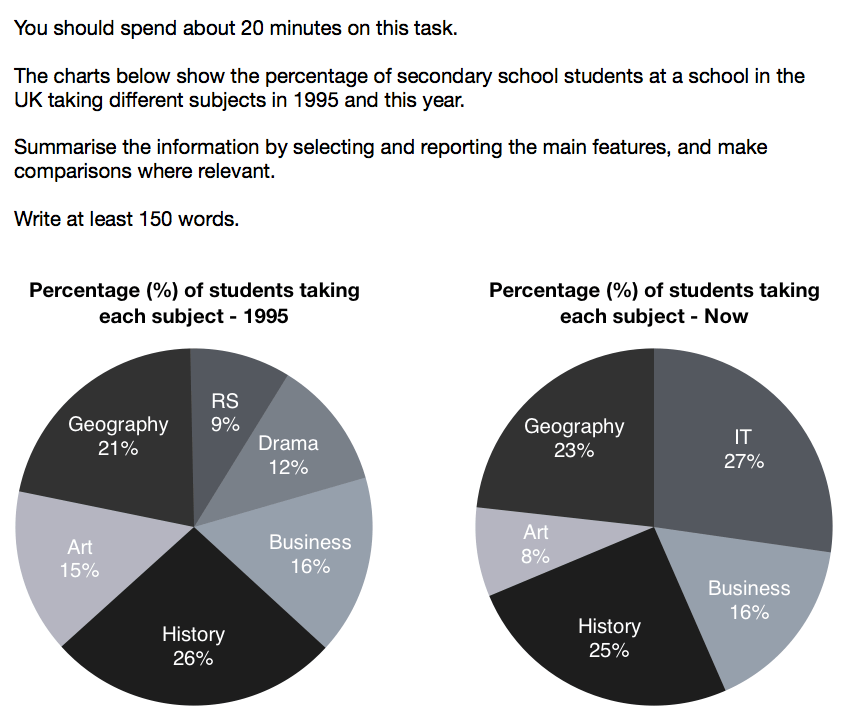
Differences in the proportions of students who took different subjects at a secondary school in the UK this year compared to that in 1995 are depicted in the given pie charts.
Overall, it is clear that no major changes are seen in the rates of students who took Geography, History and Business between the years.
As per the charts, in 1995, most students enrolled in History, which accounted for just over a quarter of the total. Though IT was the subject which most students took this year (27%), the popularity of History did not fade as exactly a quarter of the total enrolment was for the subject.
When the rate of students who took Geography was recorded at 21% in 1995, at present, a 2% increase is seen. RS and drama collectively had 21% students in 1995, while just under a sixth of the total opted for Arts.
When Arts lost 7% of students compared to that in 1995, the proportion of those who took business remained the same (16%).
Word count: 159