


You should spend about 20 minutes in this task.
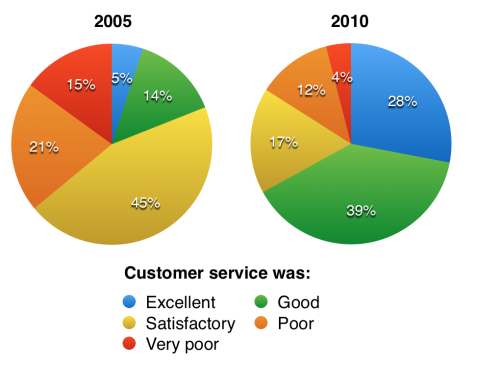
The charts below show the results of a questionnaire that asked visitors to the Parkway Hotel how they rated the hotel’s customer service. The same questionnaire was given to 100 guests in the years 2005 and 2010.
Summarise the information by selecting and reporting the main features, and make comparisons where relevant. Write at least 150 words.
MODEL ANSWER>>>
A comparison of the rating of the customer service in the Parkway Hotel, based on a same questionnaire in 2005 and 2010 is depicted in the given pie charts.
Overall, the customer satisfaction level is seen hiked considerably between the years.
In 2005, most hotel guests rated customer service as either satisfactory or poor. More than two-fifth (45%) had the first opinion about the service, whilst just over a fifth had the second opinion. About 15% of hotel guests reported the service as very poor, whereas only 14% opined it was good and only a 5% marked it as excellent.
After five years, when the same survey was repeated, the result was opposite. Most customers marked the service as either good or excellent. Those who fell under the first category accounted for 39 out of 100, while this was 28 out of 100 in case of the second. The rate of guests who recorded satisfactory fell by 28 between the years, whist the rate of those who opined ‘poor’ dropped to 12 from 21. The proportion of those who rated extreme negatively too fell substantially (from 15 to 4%).
Word count: 173