


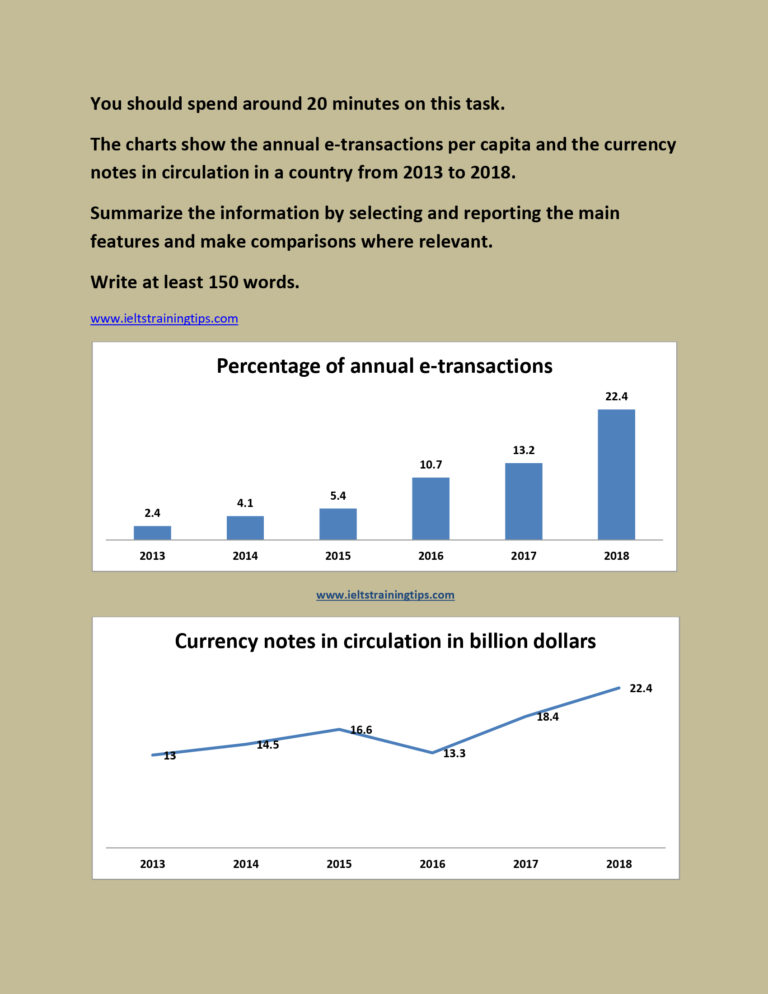
The proportion of yearly e-transactions and the circulated currency notes in a country between 2013 and 2018 are depicted in the charts.
At a glance, an upward trend is seen both in the percentage of e-transactions and in the currency circulation over this period. It is also clear that the increased percentage of e-transactions had an insignificant impact on the currency circulation.
The annual e- transaction rate recorded a ten-fold surge during this period from just 2.4 in 2013. Slower growth rates were recorded between 2014 and 2015(4.1 to 5.4%) and between 2016 and 2017(10.7 to 13.2%). However, e-transactions saw almost a two-fold growth between 2015 and 2016. A similar rise in the transaction rate was noted between 2017 and 2018 (9.2%).
A significant leap is seen in the currency circulation between 2013 and 2018. This ranged from $13 billion in 2013 to $22.4 billion in 2018. Between 2013 and 2015, its growth was gradual ($3.6 billion), however in the very next year, it collapsed to $13.3 billion. The next couple of years witnessed a sharp rise in the currency circulation by around $9.1 billion.
Word count: 158