


MODEL ANSWER>>>
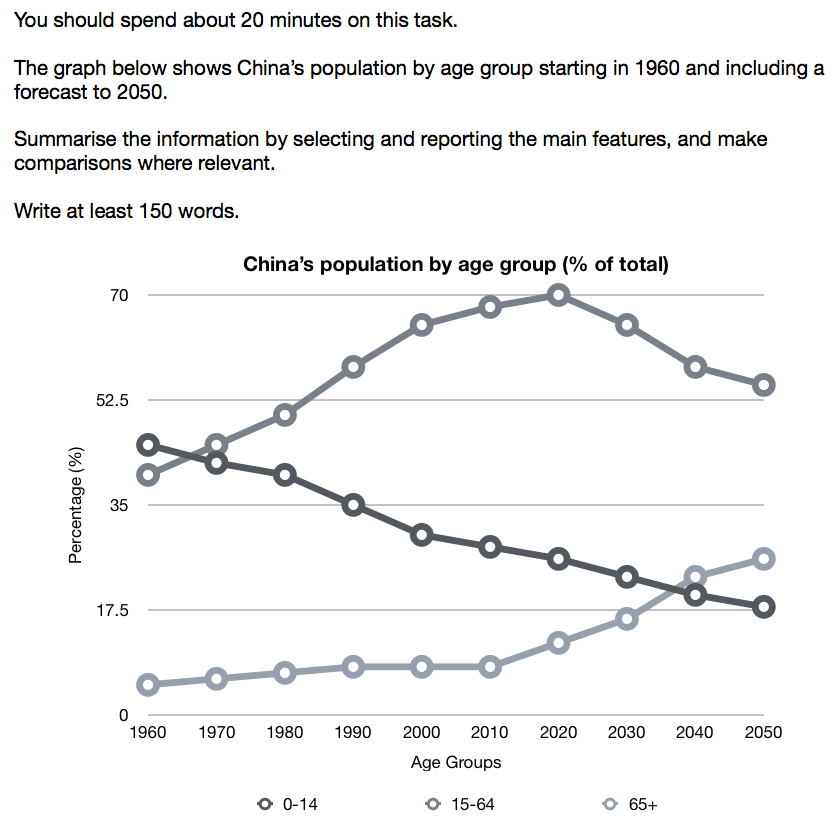
The demographic pattern of China divided by three age groups from 1960 till now, and its prediction till 2050 is depicted in the given line graph.
Overall, it is clear that when the population of the youngest and the oldest age groups are inversely proportional, fluctuations are seen in the population growth of the other age group.
As per the chart, in 1960, most population in China was under14, which included just over two-fifth of the total. When the rate of 15-64 age group stood just behind this young population (about 40%), the proportion of the oldest was extremely thin (5%).
In just five years, the percentage of the middle age group (15-64) surpassed the rate of the youngest group and swelled continuously to hit the maximum of 70% at present.(2021).
The share of the 65+ too grew, but their growth became more visible after 2010. The current population share of this group in China is just under 15%, and this is projected to hit over 25% by 2050.
On the other hand, the rate of the youngest continued to decline, and by 2050, it would hit an all-time-low of 17.5.
Word count: 175