


You should spend about 20 minutes on this task.
The graph below shows radio and television audiences throughout the day in 1992.
Summarize the information by selecting and reporting the main features and make comparisons where relevant.
Write at least 150 words.
MODEL ANSWER:
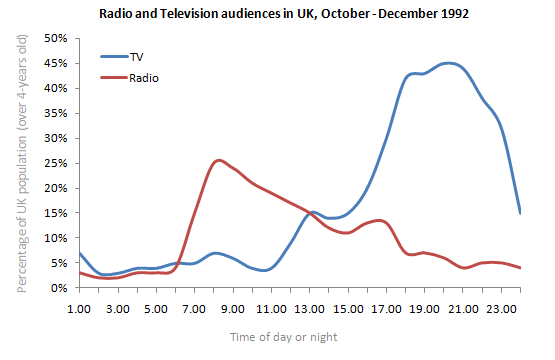
A comparison between the TV viewing population and the radio audiences (over 4 years) in the UK during the last three months of 1992 is drawn in the given line graph.
In general, the share of TV viewers was higher than the on air entertainers and this trend was evident in the afternoon, especially in the evening.
As per the chart, whether it is TV or radio, the proportion of audiences remained less in the early morning (under 5). However, this rate soared in case of radio audiences after 6 am to reach just over 25 by 8 am. Thereafter, this proportion fell almost at a gradual rate back to around 5 by 12 am and further to 3 by 2 am.
Despite remaining subdued till around 12 pm, the rate of TV viewers overtook the radio audiences at 1 pm, when it registered around 16% viewers. After a couple of hours, this rate rocketed to reach around 45%, at 9 pm. From this point, the rate of its viewers dwindled to reach about 3 at 2 am, the time when the rate of audiences for both TV and radio stood the least.
Word count:176