


MODEL ANSWER>>>
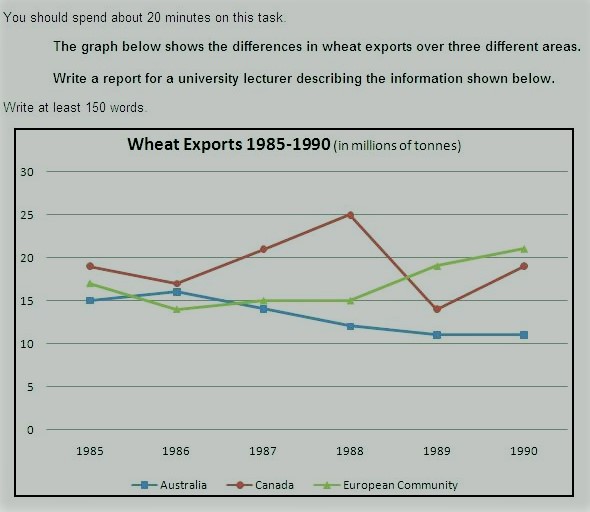
Variations in the pattern of wheat exports in three areas from 1985 to 1990 is depicted in the given line graph.
Overall, it is clear that Canada exported most wheat, while Australia and European community exhibited a diverging trend over the period.
As per the chart, in 1985, wheat exports from all these areas stood between 15 and 20 million tonnes, with Canada the topmost exporter (19 million tonnes). Australia exported 15 million tonnes wheat this year, which was 2 million less than the European community.
While there was a slight dip in the exports in Canada and European community next year, Australia had made a slight progress. However, Australia could not maintain this dominance for long, as its export figures fell gradually to just above 10 million tonnes by 1989-90. On the other hand, the wheat exports from European community showed a revival by 1987, when it surpassed Australia’s figures, and after a year, it grew by about 5 million.
It is interesting to see that Canada making substantial progress between 1986 and 1988. In the latter year, its wheat exports hit 25 million tonnes, which was the highest among the group over the period. From this point, the exports plunged to under 15 million in 1989, which later exhibited a recovering trend (19 million tonnes) by 1990.