


You should spend about 20 minutes on this task.
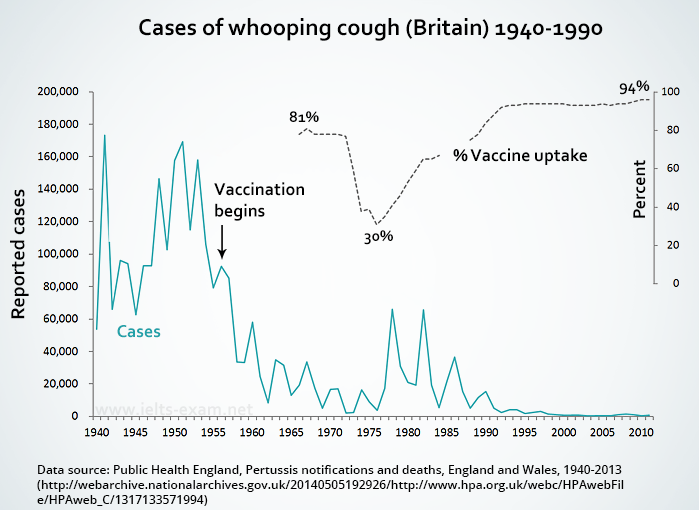
The graph shows the impact of vaccinations on the incidence of whooping cough, a childhood illness, between 1940 and 1990 in Britain.
Summarise the information by selecting and reporting the main features, and make comparisons where relevant.
Write at least 150 words.
MODEL ANSWER:
The impact of the introduction and use of vaccine against whooping cough, an ailment among children in Britain between 1940 and 1990 is depicted in the given line graph.
At a glance, it is clear from the graph that the vaccine administration and the disease prevalence had an inverse relation over the given period.
As per the chart, there were around 55,000 reported cases in 1940. Until the introduction of the vaccine in 1955, there were four notable spikes in this number, and the highest was reported in 1942 (170,000 cases). The other three happened between 1947 and 1953.
Since the launch of vaccine in 1955, the number of positive cases fell from approximately 90,000 to almost nil by 1973. However, after the percentage of vaccine uptake dropped to 30 in 1976 from 81 in 1965, the number rose again and hit 60,000 twice before 1983.
The vaccine uptake is seen climbing then after and by 1990, over 90% of the British children had access to this vaccine. The result was a substantial fall in the positive cases (nearly zero).
Word count: 160