


MODEL ANSWER>>>
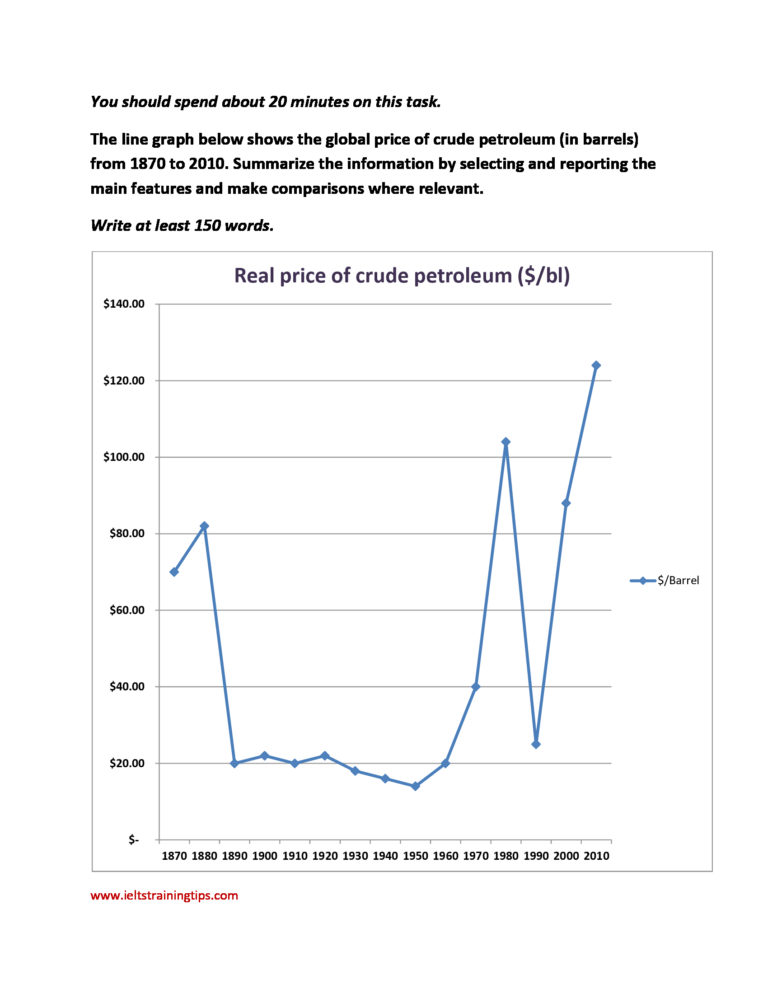
The price variations of the crude petroleum oil around the world from 1870 to 2010 are illustrated in the given line graph.
Overall, it is clear from the graph that the price of crude petroleum per barrel varied throughout the years and this variation was more prominent in the beginning and in the end of the period.
It is clear from the graph that in 1870, the price of one barrel crude petroleum was relatively high, at around $70. In the next 15 years, it surged by $12 before plunging to $20 by the end of that century.
The price hovered around the same value till 1935 and slipped gradually to approximately $15 by 1955.
In a decade, it gained the momentum and then the price of the crude oil hiked sharply to reach above $100 by 1985.
The price variation became sharper then after, which was marked by an unexpected slump of around $80 by 1995 and a huge leap of around $100 by the end of the period.
Word count: 155