MODEL ANSWER>>>
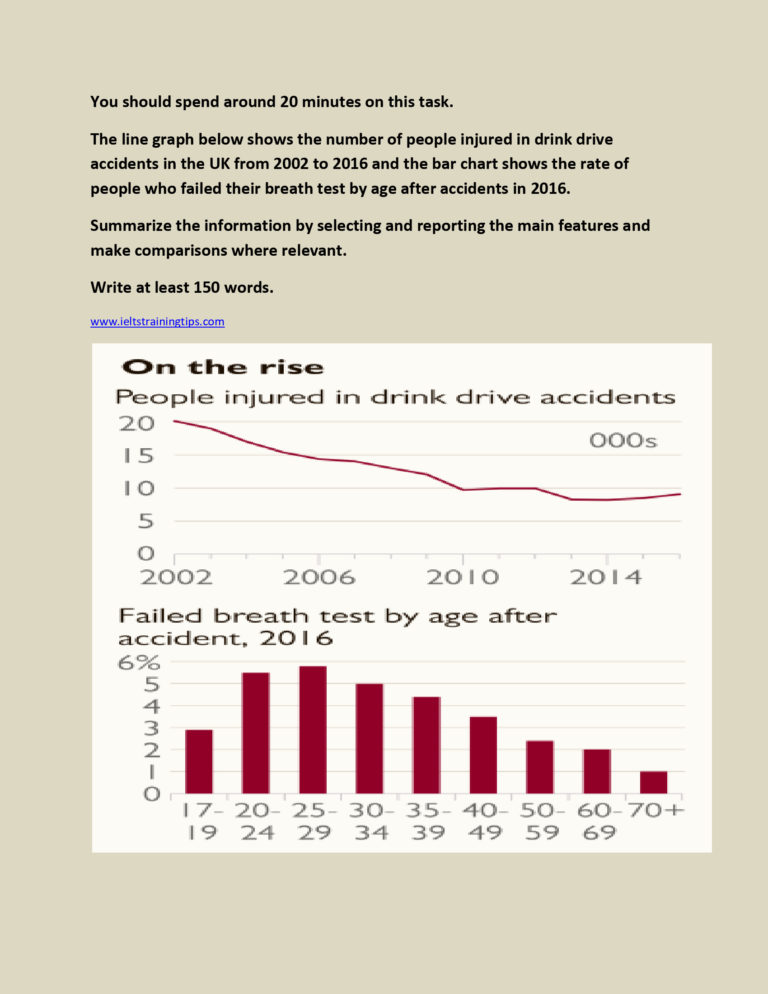
A statistical analysis on the volume of people injured in drink drive accidents from 2002 to 2016 and the proportion of people who could not clear their breath test by age after accidents in the UK in 2016 is depicted in the given charts.
Overall, it is clear that the drink drive injuries were decreasing in number in the UK over the period, while the proportion of youth who failed breath test was comparatively more in the given year.
As per the line graph, the highest number of accidents which reported injuries over these 14 years was in 2002 with around 20,000 casualties. This halved in a period of eight years and stood under that mark till 2016.
Turning to the rate of breath test failures, the most unsuccessful were the youths between the age 20 and 39. This ranged between 4.3 and 5.9%, of which the 25- 29 age group stood at the top, whereas the lower rate was shown by the older group (35-39). It is noted that as the age advanced, the failure rate shrank, and this was recorded as low as 1% in case of people over 70.
However, in the adolescent group, 3% failed in breath tests, whose rate was just 0.2 less than the 40-49 group.