


You should spend about 20 minutes on this task.
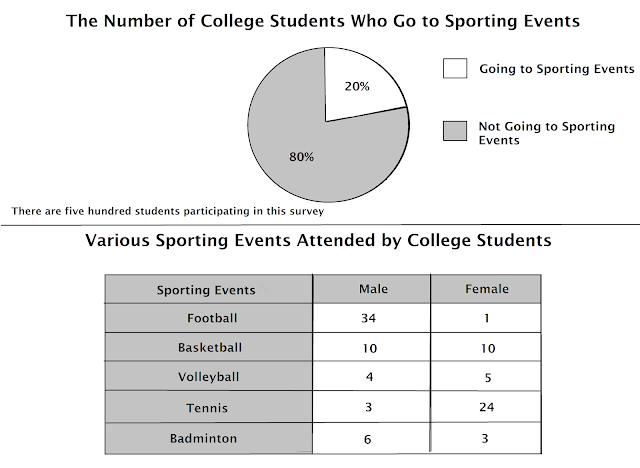
The pie chart and the table below show the result of a survey on the number of students who participate in sporting events and their attendance in such events based on gender.
Summarize the information by selecting and reporting the main features and make comparisons where relevant.
Write at least 150 words.
MODEL ANSWER>>>>
A survey report which analysed the participation of college students in sporting activities and the type of events in which they are involved in divided by gender is depicted in the given charts.
Overall, it is clear that very less students are interested in these events, in which there is a male domination.
As per the pie chart, most college students are seen not involving sports, and this accounts for 400 out of the total 500 surveyed.
Turning to the involvement of the available 100 students, male participation is seen more; however the participation pattern differs as the type of sport activity differs. When most males are seen playing football (34), tennis is observed as the favourite sporting event for females (24). The number of basketball players from both genders is exactly the same at 10, out of the nine who played volleyball, five are females. The number of male badminton players is double than that of their female counterparts (6:3). The least male involvement in these activities is in tennis (3), whereas it is football (1) for females.
Word count: 170