MODEL ANSWER:
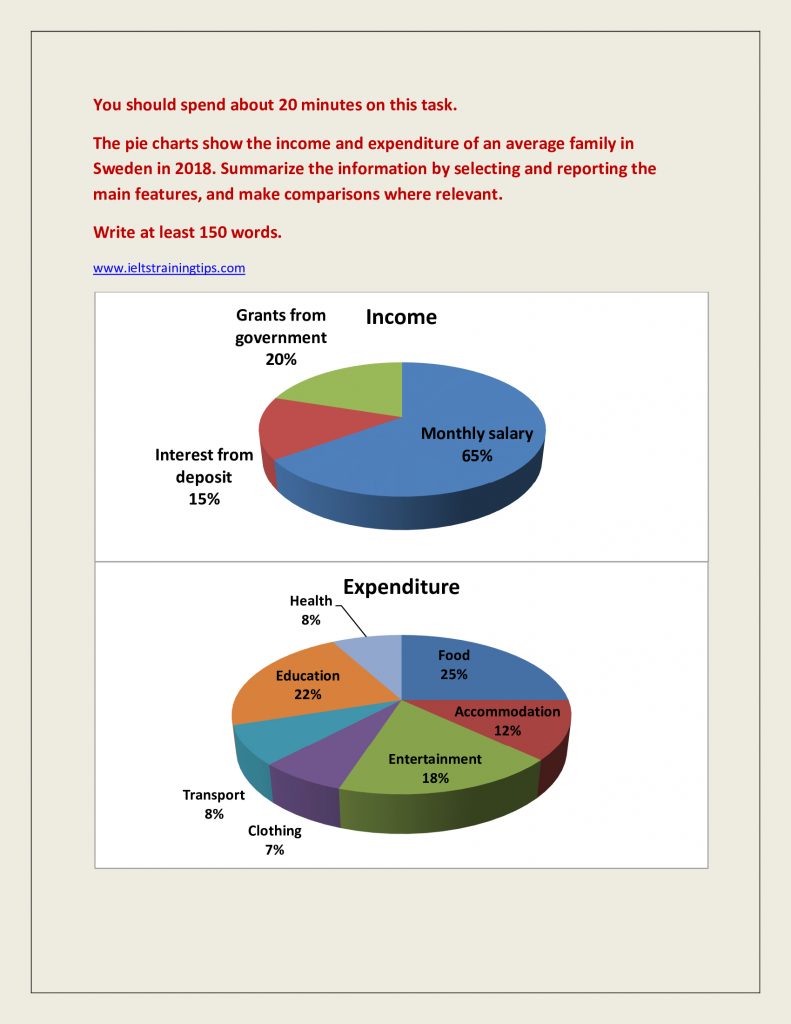
The proportional difference between the Swedish income and expenditure in 2018 is portrayed in the given pie charts.
As shown in the first pie chart, the lion’s share of the income in an average Swedish family came from its monthly salary (65%). Nearly a fifth of the source of income was from the financial grants from the Swedish government and the rest (15%) was from the interest from the bank deposits.
Turning to the pattern of expenditure, the major outflow was for meeting the food expenses, which constituted for about a quarter of the total. This was closely followed by educational expenses (22%). When the average disbursement of income of the Swedes was just under a fifth (18%) on entertainment, it was just over a tenth on accommodation. When an equal proportion of money was spent on travelling and on meeting their health requirements, the least was spent on clothing (7%).
Overall, it is clear that the Swedes depended majorly on their monthly income and they expended most on food in the given year.
Word Count: 168