You should spend about 20 minutes on this task.
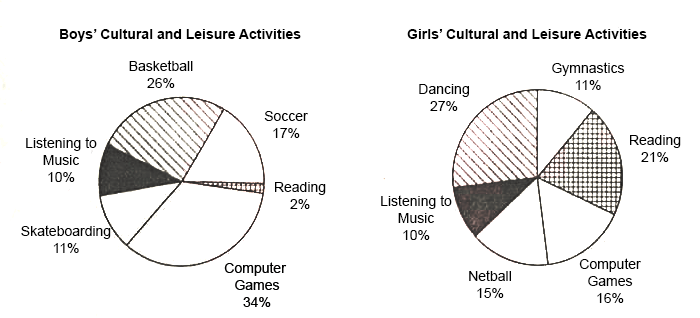
The pie graphs below show the result of a survey of children’s activities. The first graph shows the cultural and leisure activities that boys participate in, whereas the second graph shows the activities in which the girls participate.
Write a report describing the information shown in the two pie graphs.
Write at least 150 words.
Information on the cultural and leisure activities both boys and girls participate in, which is obtained as the part of a survey is depicted in the given pie charts.
Overall, it is clear that except in listening, the interests of both genders vary widely.
When the involvement of activities both the genders participate in, an obvious proportional disparity is seen in reading and computer games. When only 2% of boys are keen in reading, it is 21% in case of girls, which is more than 10 times. However, 34% boys play computer games, which is more than double the number of girls who play the same. In case of listening to music, an equal share of 10% is involved.
The second most popular activity among boys is basketball, followed by soccer. When just over a quarter boys play basketball, in case of soccer, it accounts for just over a sixth (17%). Only 11% show interest in skateboarding.
The most popular activity among girls is dancing, and this accounts for 6% more than those who read. Other activities in which they are interested are netball and gymnastics. When 15% girls play netball, 11% are involved in gymnastics.
Word count: 196