


You should spend about 20 minutes on this task.
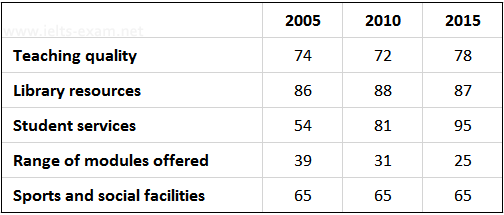
The table below shows the results of surveys in 2005, 2010 and 2015 about McGill University.
Summarise the information by selecting and reporting the main features, and make comparisons where relevant.
Write at least 150 words.
Percentage of students giving good ratings for
different aspects of McGill University
MODEL ANSWER>>>
Statistical information on the way which students responded to the performance of a university called McGill in 2005, 2010 and 2015 is illustrated in the given table.
It is clear from the table that the response was generally positive in nature in all the three years, except for the range of modules offered.
In general, most students rated library resources as their favourite in the university. When 86-88% students rated it good, in 2015, student services had become the most rated service (95%). The growth in rate of students who rated the service grew from just 54 in 2005 to 81 in 2010, before hitting this peak.
Teaching quality was also rated high by a considerable proportion of students. Despite a fall of just 2% in 2010, the percentage of students who reported it as good grew from 74 to 78 between 2005 and 2015.
When the share of students who marked sports and social facilities remained the same in all the three years (65%), the only area in which students expressed their discontent was in the range of modules offered. Here, the decline was from 39% to 25%.
Word count: 170