


MODEL ANSWER>>>
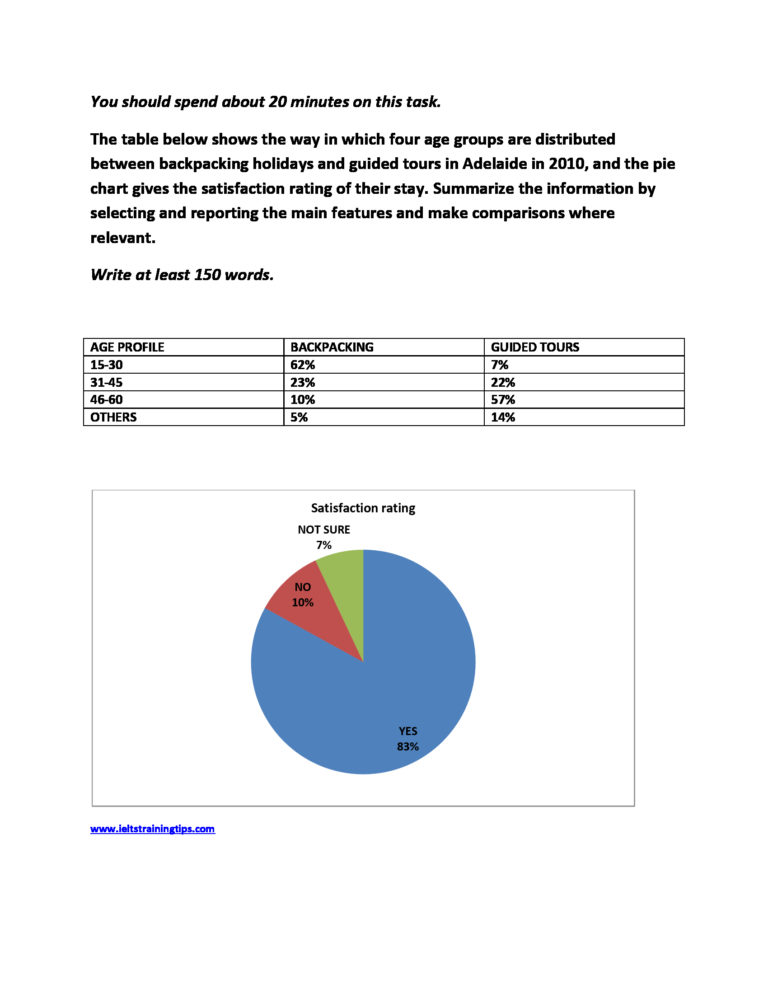
The table provides a breakdown by selected age groups of those backpacking and guided tours in Adelaide in 2010, and the pie chart indicates satisfaction report about their holidays.
Overall, it is clear that when the younger age groups went for backpacking, older groups preferred to have guided tours and most of them expressed a high satisfaction rate in the given year.
As can be seen from the table, the preference of people these four age groups on the twin types of holiday varied considerably. Majority of those who went backpacking holidays fell under 15-30 age range (62%), whereas, only 7% of the same age group went for guided tours. This pattern was almost opposite when it came to 46-60 year-old group. They made up 57% of those on guided tours, accounting only 10% of backpackers.
The age preferences for both backpacking and guided tours included roughly equal proportions from the 31-45 age group: 23 and 22 %.
Turning to the pie chart, Adelaide was rated as a popular holiday destination among majority of all holiday-makers, with a massive 83% from both groups stating they enjoyed their holiday, whilst a mere 10% expressed their disapproval on the same.