


You should spend about 20 minutes on this task.
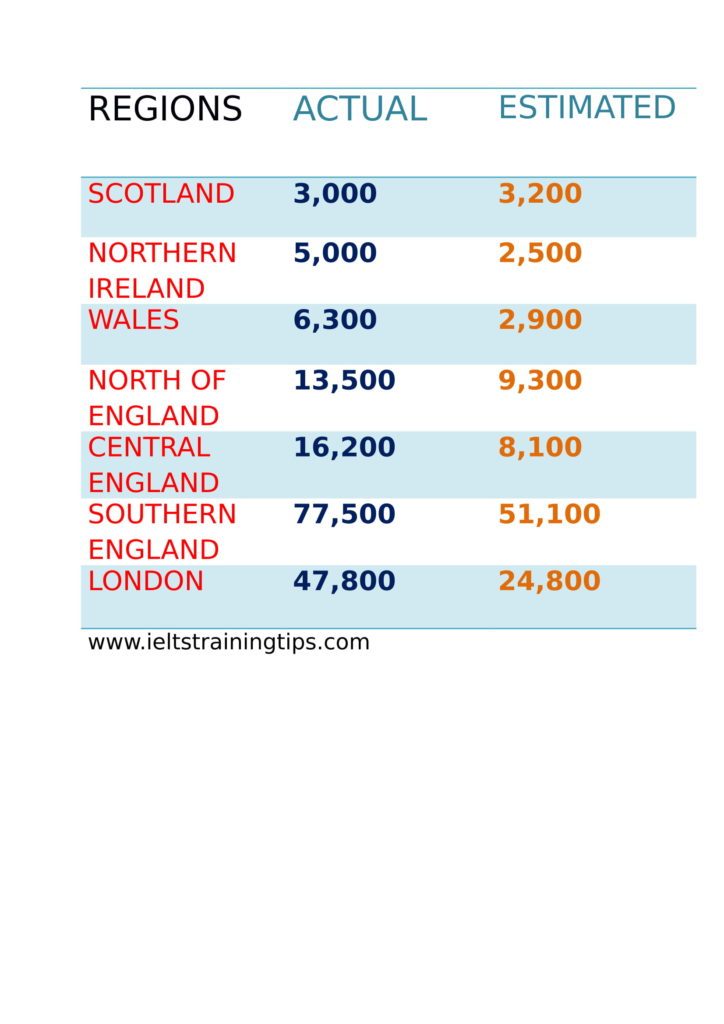
The table shows information on the number of estimated and actual numbers of houses built in the UK by region in 2015. Summarize the information by selecting and reporting the main features and make comparisons where relevant.
Write at least 150 words.
MODEL ANSWER>>>
The difference between the estimated and actual number of houses built in the UK by region in 2015 is shown in the given table.
Overall, the number of houses actually built in all these regions excluding Scotland was above its estimated number.
As per the table, the difference between the aggregate number of actual and estimated houses built in the UK in 2015 was 67,400. The maximum disparity between these figures is seen in Southern England (26,400), when the actual figure was recorded at 77,500. The second major disproportion is seen in London, where 47,800 houses were tangible; 23,000 more than its anticipated goal.
The completion of the construction of houses was the notably successful in both Northern Ireland (50,000) and Central England (16,200), touching 200% of their estimated figures. The actual number of houses exceeded the projected number in both Wales (6,300) and Northern England (13,500), with a disparity of 3,400 and 4,200 respectively.
However, Scotland remained as an exception, where the number of actual houses constructed was only 3000, which were 200 below its projection.