MODEL ANSWER:
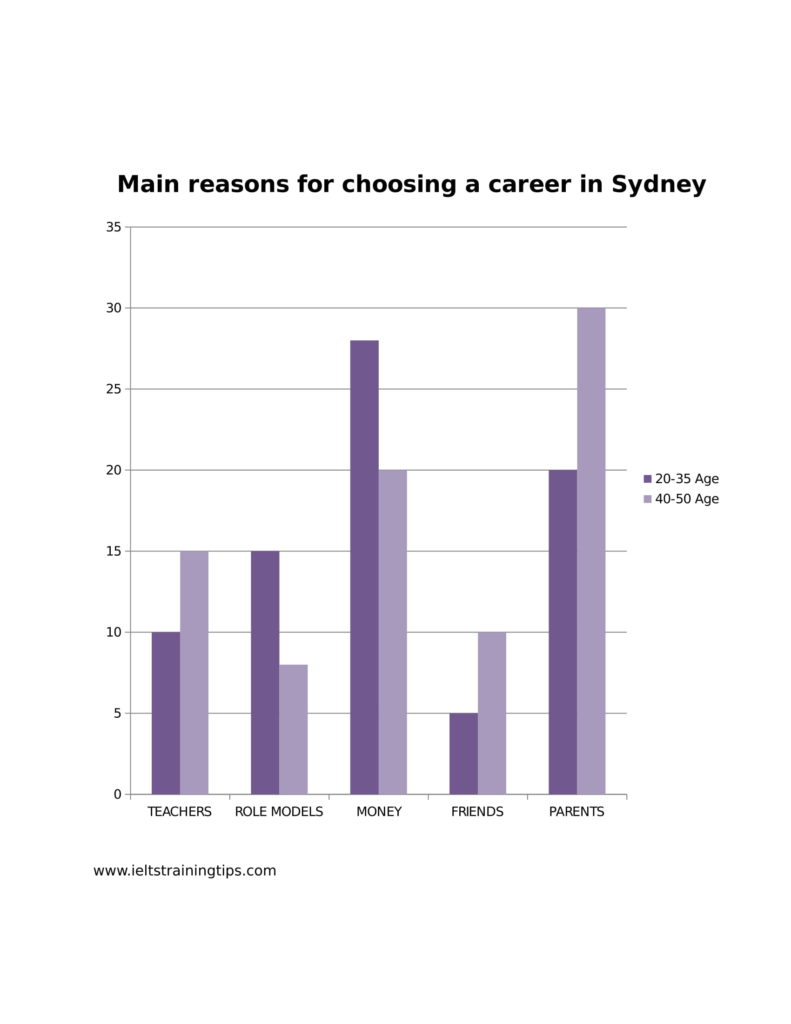
Information from a survey result on the main reasons for choosing a career among two age groups, 20-35 and 40-50 in Sydney in the year 2015 is depicted in the given bar graph.
It is clear that the two groups were influenced by the various factors to different degrees, with the most influential factors which contributed to career choice for the 20-35 age group being money ( approximately 28 per cent)and then parents ( 20 per cent). However,the factors were the reverse for the 40-50 age group,with parents affecting them the most at 30 per cent.
As regards teachers and role models, the relative importance of each was again the other way round: 10 and 15 per cent respectively for the younger group,and 15 and 8 per cent for the older.
The only similarity between the two age groups was that friends had less influence over career choice for the younger and older groups than any other factors, five and ten per cent respectively.
Overall, it is clear from the graph that the influencing factors for opting career fluctuated between the age groups.