MODEL ANSWER:
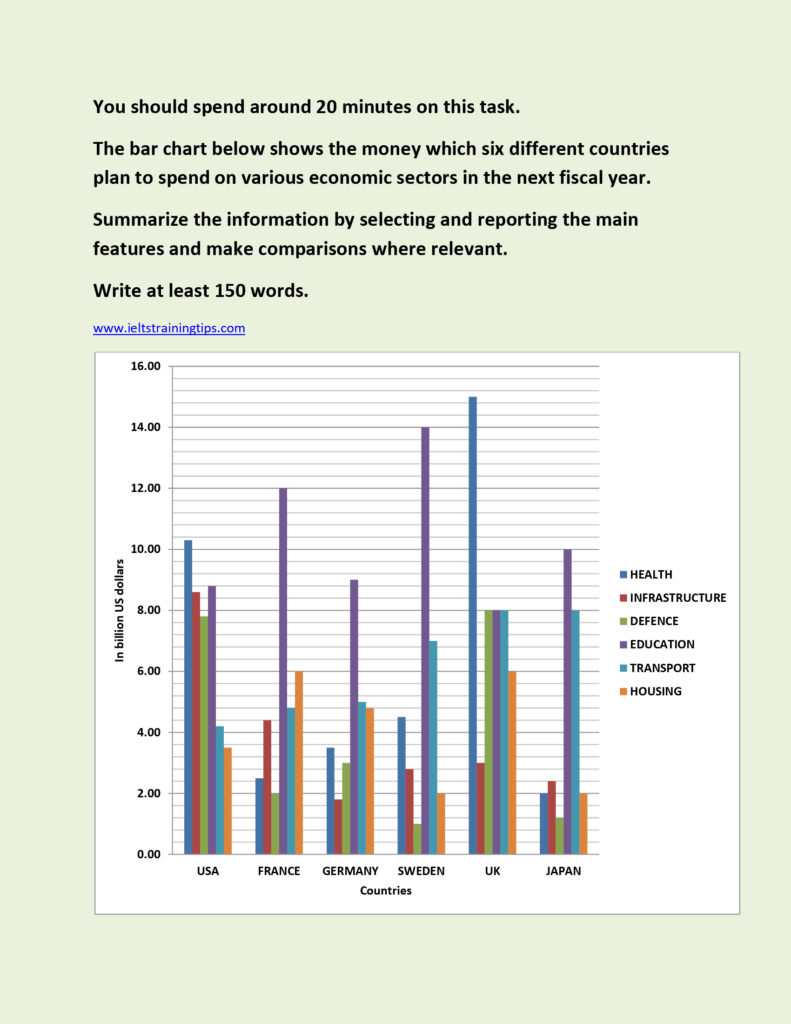
The way in which the projected spending on particular sectors differs in six different countries in the next fiscal year is depicted in the given bar graph.
As per the graph, education is the area where almost all countries are expected to spend a considerable amount of money (an average of over USD 8 billion). Out of these countries, Sweden would stand first, with a spending margin of $14 billion, whereas the UK is likely to spend 6 billion lesser. The UK is anticipated to spend the same amount of money on transport and defence; however, their expenditure would go up to nearly $15 billion in the health sector. The USA’s defence expenditure is predicted to be very similar to the UK’s, but a wide disparity is seen between the two in infrastructure (over $5 billion). Compared to educational expense ($12 billion), the estimated spending of France on other sectors like transport and housing is relatively low, and the case is similar for Japan and Germany. Another feature to be noted is the projected spending of the USA on health is comparatively higher. The least among all spending can be seen in the defence expenditure of Sweden ($1billion).
Overall, except in case of education the spending pattern of these countries would differ widely in coming year.