MODEL ANSWER:
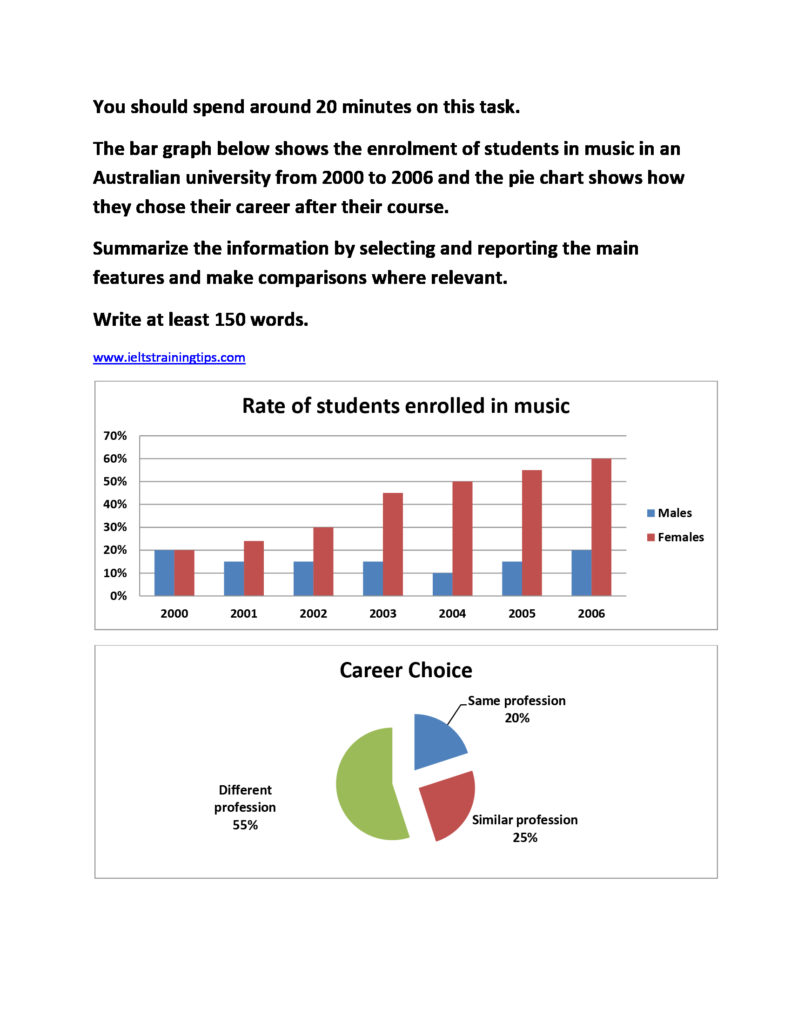
A statistical analysis of the proportion of students enrolled in music and their career preferences in a university in Australia from 2000 to 2006 is made in the given charts.
The bar graph, which is given first, shows that female students had a significant affinity towards music over this period, in which their enrolment rate in music ranged from 20 to 50%. This was progressive in nature throughout the period, whereas the male students had never shown an enrolment rate over 20 during this period. From 2000, when the male and female ratio remained the same, the rate fluctuated between 10 and 15 for males, in which the year 2004 witnessed the minimum. On the other hand, the maximum rate recorded for females was in 2006 (50%).
The pie chart, which follows, shows the post course career preference of these students. When only a fifth of the total chose the same profession, a quarter of them chose similar ones. It is interesting to note that those who had opted a different profession were over the half of the total.
Overall, it is clear from the charts that, when more female students opted music at the university, the career choice of most course completed students was not preferably the same.