MODEL ANSWER:
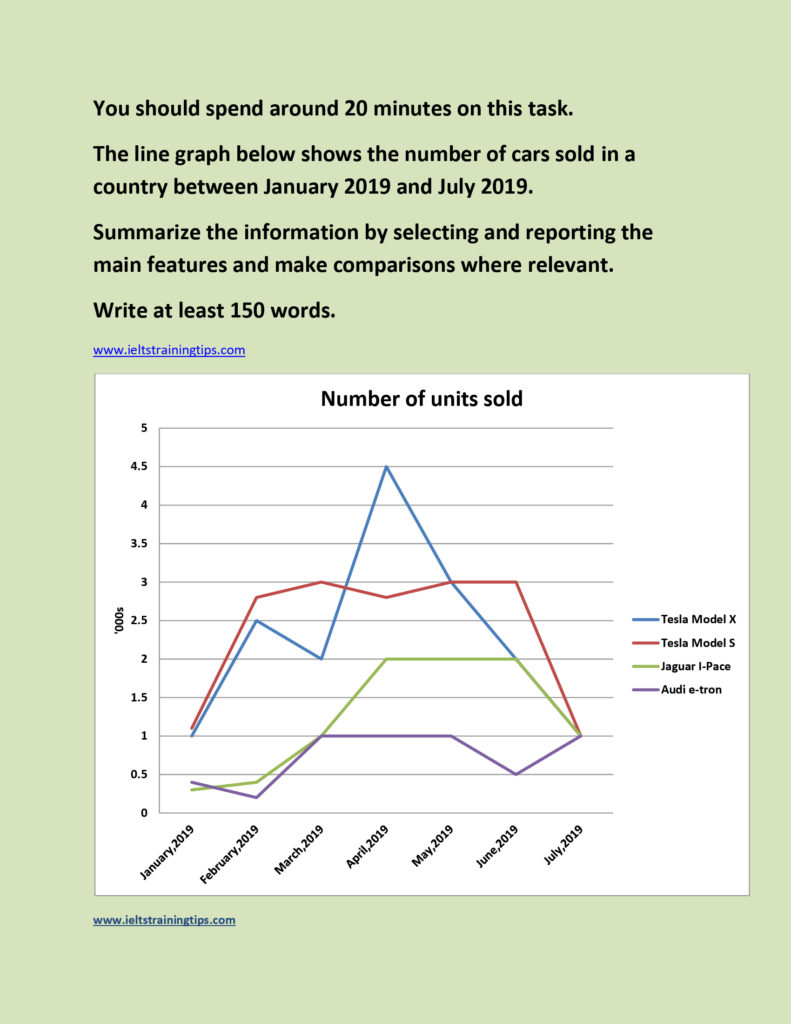
The details of number of cars sold in a country between January 2019 and July 2019 are portrayed in the given line graph.
As shown in the chart, the sale of Tesla Model S is seen consistent and positive in most of the period. Despite in the beginning and in the end, its sale accounted for nearly 3,000 in number. The biggest spike in the sales is seen with Tesla Model X and the figures reached up to 4,500 in April 2019.
April to June 2019 was also favorable for Jaguar I-Pace along with Tesla Model S and its sale figures stood stationary at 2,000. The least ever sales is recorded for Audi e-tron and this was in February 2019 and it could never sell a car over 1,000 in the given period. However, it was the only successful model between June and July 2019.
Overall, out of the four models except Tesla Model S all other models showed visible fluctuations in the given period.
Word count:155