


You should spend about 20 minutes on this task.
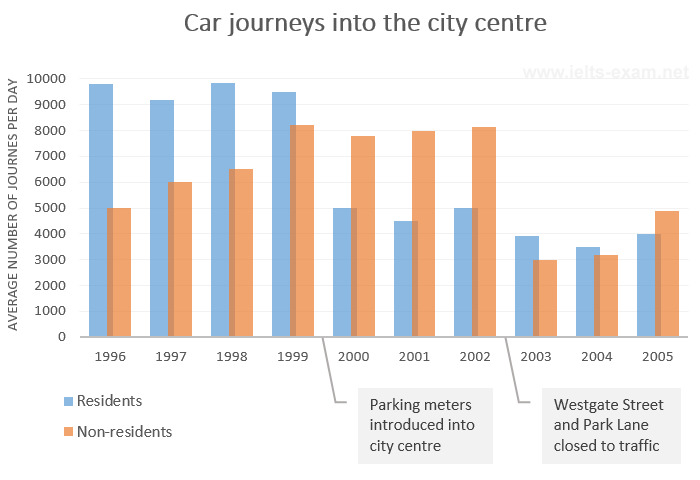
The bar chart gives information about the number of car journeys into the city centre made by residents and non-residents.
Summarise the information by selecting and reporting the main features, and make comparisons where relevant.
Write at least 150 words.
MODEL ANSWER>>>
The frequency of car journeys made per day by both residents and non-residents into the city centre from 1996 to 2005 is depicted in the given bar chart.
Overall, it is clear that the frequency of travel declined with the introduction of parking regulations in case of both groups of commuters.
From 1996 to 1999, there were more journeys made by the residents to the city centre than the non-residents. In 1996, this was nearly 10,000 journeys per day, and it remained more or less the same till 1999, despite some mild fluctuations. In 1996, the frequency of travel by non-residents was about 5000, and this climbed each year to hit nearly 8000 by 1999.
With the introduction of parking meters in the city centre by 2000, the resident traffic halved and this remained nearly the same till 2002. However, the reform had not affected the non-residents’ travel during this period.
By the end of 2002, traffic was banned in the Westgate Street and the Park Lane, and this reduced the traffic to the city centre considerably. While in case of residents, the figures fell by an average of 1000 and almost levelled, in case of non-residents, it plummeted to about 3000 from nearly 8000. However, it increased gradually to reach over 5000 by 2005.