You should spend about 20 minutes on this task.
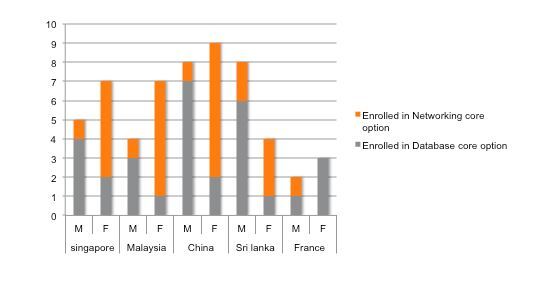
The bar chart shows the number of overseas students enrolled in a third year Computer Science course at a Canadian college.
Summarise the information by selecting and report in the main features, and make comparisons where relevant.
Write at least 150 words.
Information on the enrolment statistics of third year non-native students in two specific Computer Science courses in Canada is depicted in the given bar graph.
Overall, it is clear that when more females enrolled in networking core option, it was males who dominated the Database core option.
As per the chart, most joining were from China (17). When the number of female enrolment in networking core option was 7 out of 9, it was just one out of 8 in case of males. When the male enrolment in this option stood at one from Singapore, Malaysia and France, as same as China’s, it stood different in case of Sri Lanka, where the number is seen as two.
Almost similar to China’s statistics, out of the total 7 enrolments, the number of females who enrolled in networking core option stood higher among those from Singapore and Malaysia at 5 and 6 respectively. The number of male admissions for database core option from these countries was recorded at 4 and 3 respectively, whereas the female statistics stood at two and one. The male enrolments in this option from China and Sri Lanka were 7 and 6 respectively, whereas only one person came from France. Most female admissions in this subject were from France, and this was 3.