


MODEL ANSWER>>>
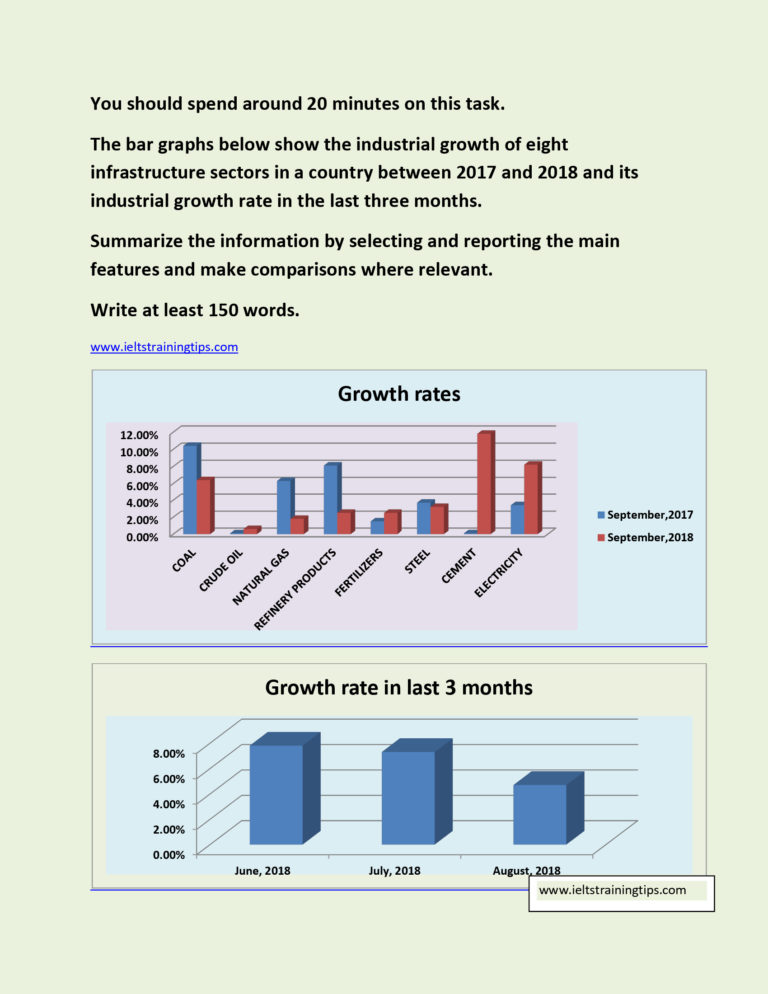
A comparison of a country’s industrial growth in eight different infrastructure sectors between the months of September,2017 and 2018 and its overall industrial growth rate over the last three months prior to September 2018 are portrayed in the given bar charts.
Overall, it is clear that the overall trend was not so good for the country, excluding cement and electricity industries.
Turning to the first graph, out of the eight sectors, four showed a positive growth. Of these, the rate of growth was exceptional in case of the cement industry, which exhibited a 10% hike from just 1%.The sector of electricity too made a huge progress from 2.5 to nearly 8%.The other two sectors which are in this group namely crude oil and fertilizers did not make over a per cent growth.
By contrast, of the sectors who marked a negative growth, the minimal loser was the steel industry with just 1% negative growth. However, the rest three( Coal, refinery and natural gas) suffered a loss of around 4% or more.
Turning to the growth percentage of the industrial sectors as a whole, in the last three months before September,2018 there was a clear decline from around 7% to under 4%.