


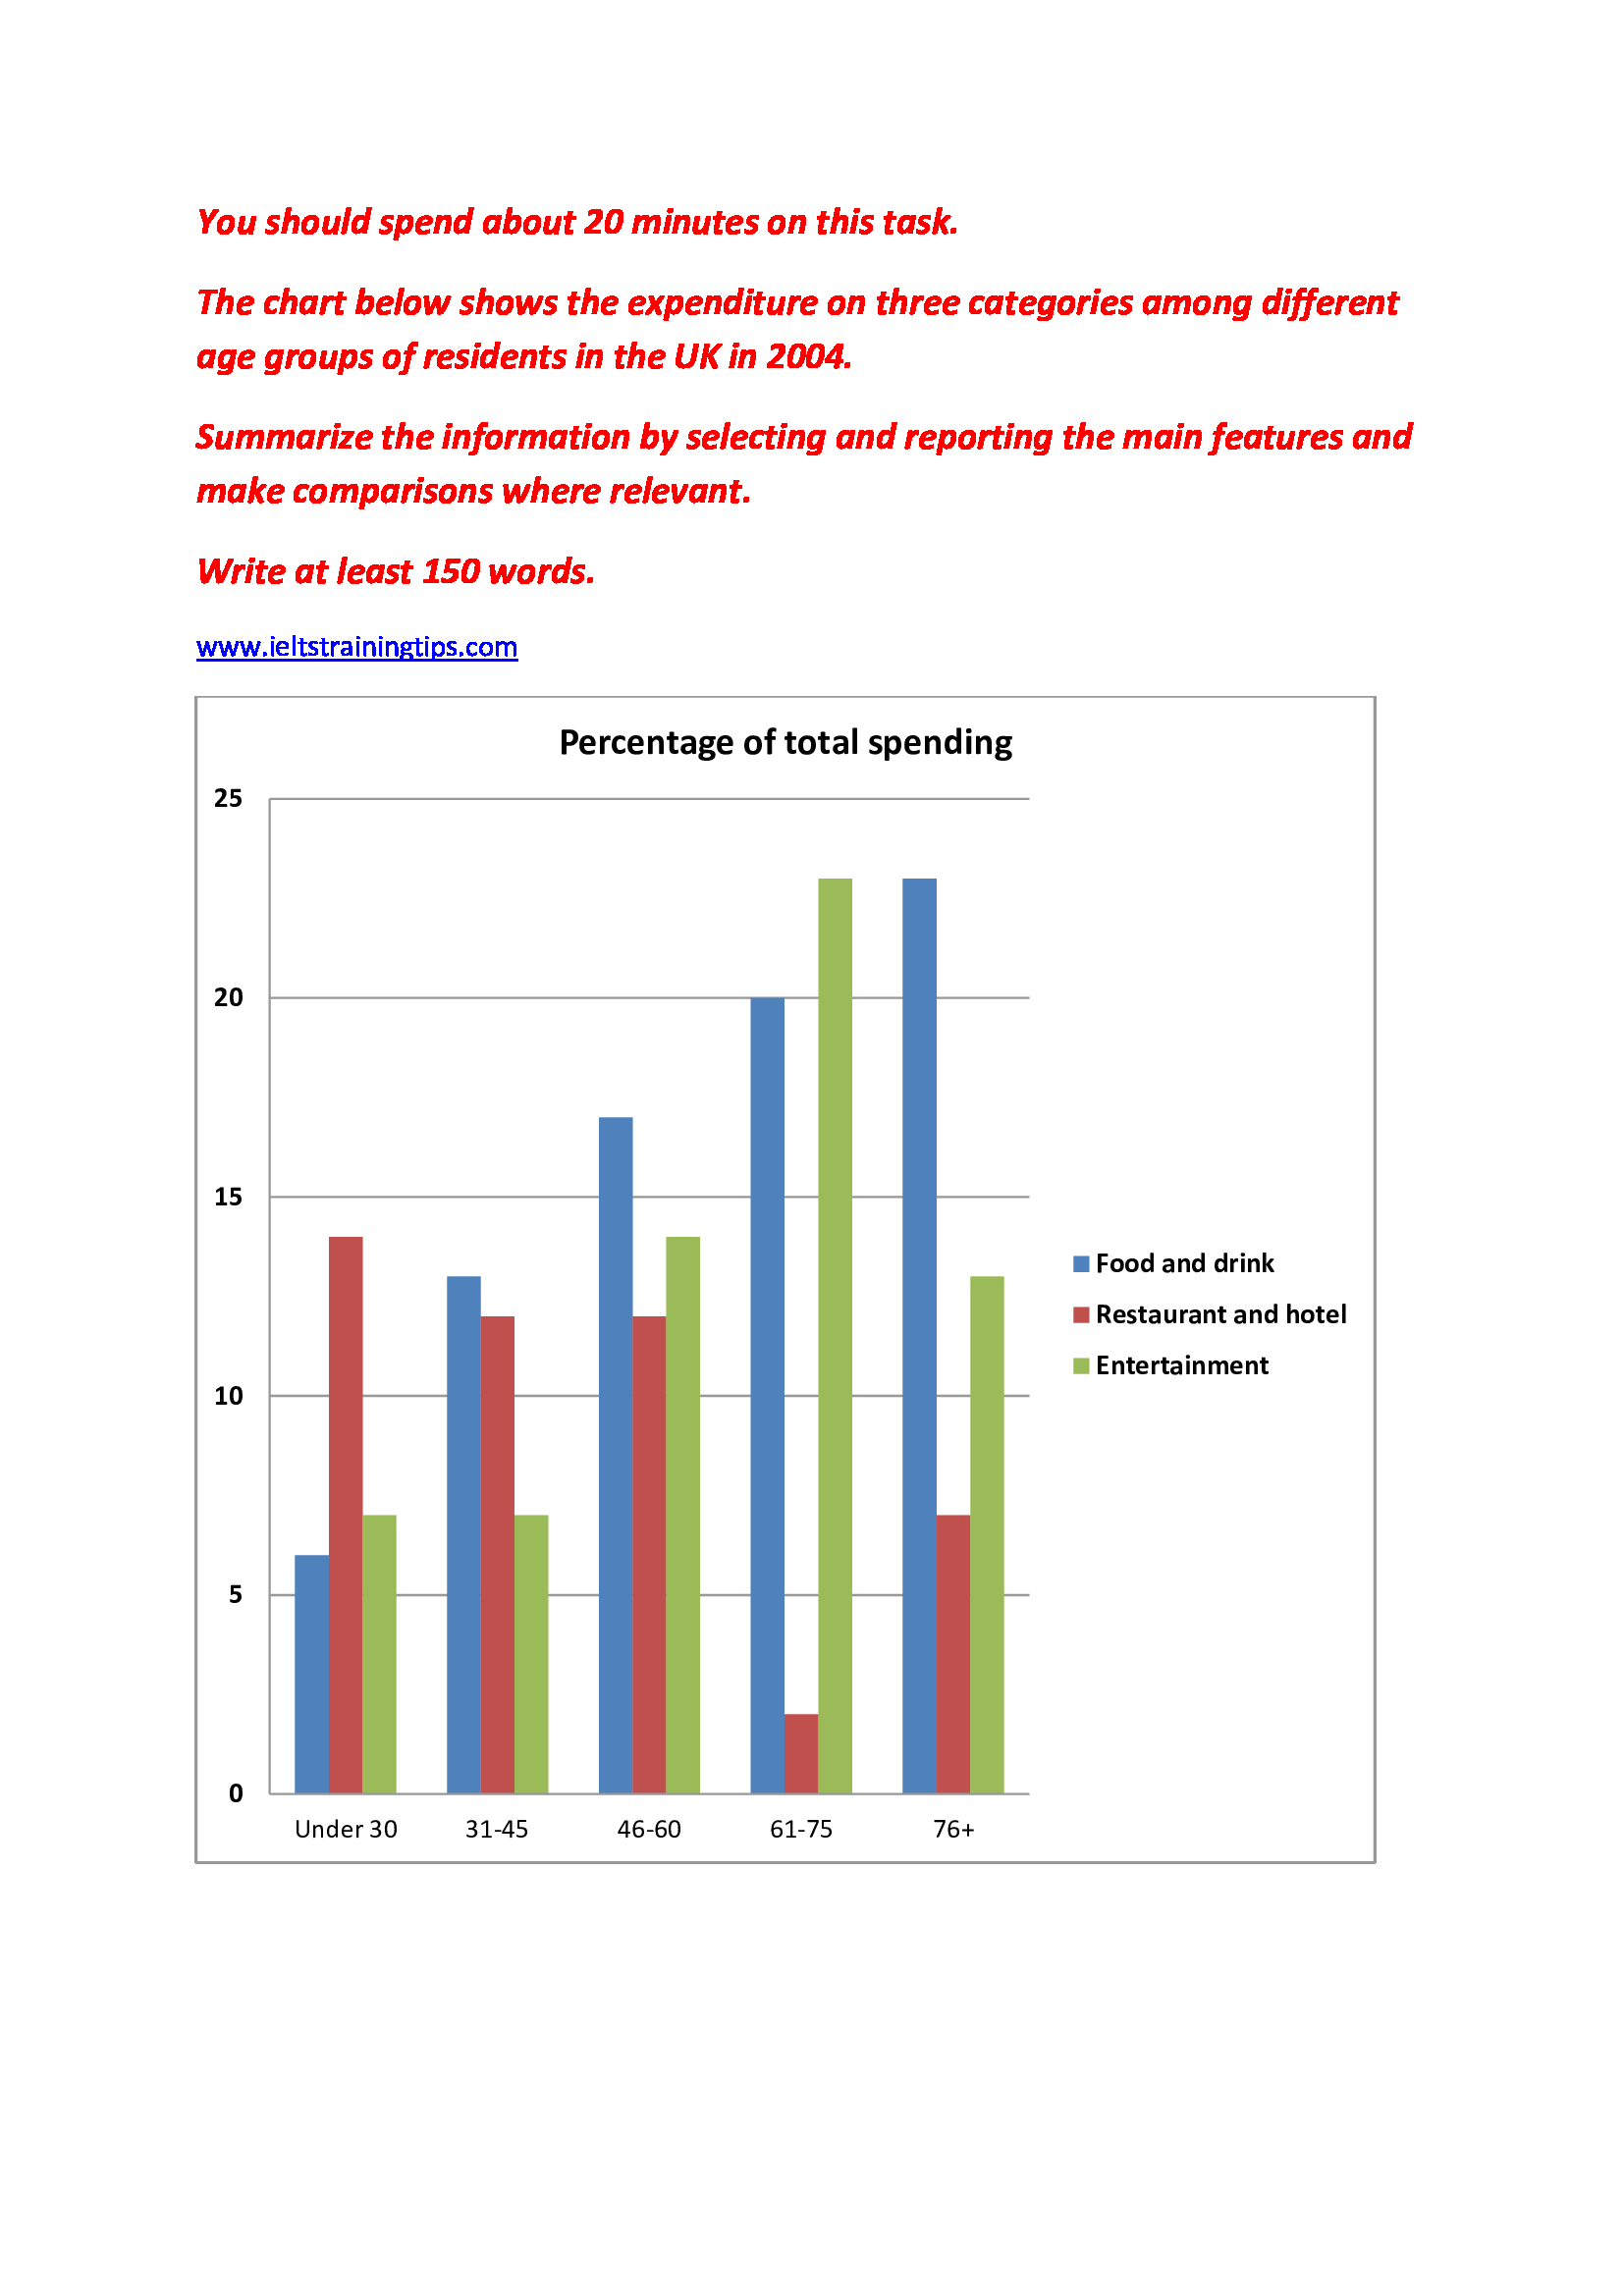
The bar graph provides statistical information on the way which the spending of the UK residents divided by age differed on three specific areas in 2004.
In general, out of the total expenditure, most spending was on food and drink, and it is seen increasing as the age advanced.
As per the chart, the spending habit of the two older age groups (61-75 and 76+) was almost similar, and was entirely different from their younger groups. These age groups spent a higher proportion of their aggregate spending on food, drinks and entertainment than on restaurants and hotels. When oldest group spent about 23% on the first two, their younger counterpart spent 3% less on those. However, in case of entertainment, the 61 to 75 age group spent 23%, whereas those who were over 76 expended 10% less.
The disbursement pattern of the residents aged under 60 was very dissimilar. When the youngest spent most on hotels and restaurants (14%), major shares of their older groups (31-45 and 46-60) were spent on food and drinks (13% and 17% respectively). The average spending on restaurant and hotels was 13% for all these three groups, while on entertainment, this ranged progressively as per the age advanced, and was from 6% to 14%.
Word count: 189