


You should spend about 20 minutes on this task.
The chart below shows the number of men and women in further education in Britain in three periods and whether they were studying full-time or part-time.
Summarise the information by selecting and reporting the main features, and make comparisons where relevant.
Write at least 150 words.
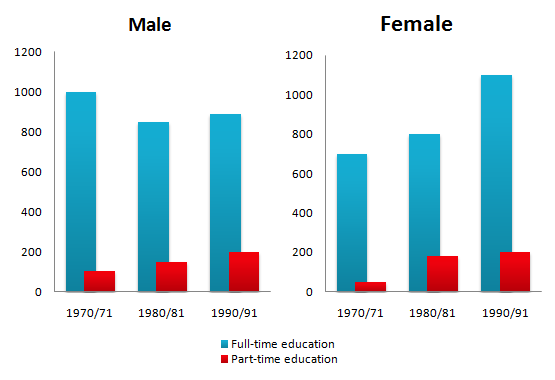
Information on the number of Students who did further education, both full-time and part-time in Britain between 1970-71 and 1990-91 is depicted in the given bar chart.
Overall, it is clear from the chart that students were more in to full-time rather than part-time education irrespective of gender during the given period.
While the number of male students who did full-time education was fluctuating, the volume of female students who did the same is seen increasing over this period. In case of the former, the figures fluctuated between 800 and 1000, whereas in case of the latter, it grew from around 700 to nearly 1100.
Turning to the part-time education, the male students showed a consistent growth in their number over the period, and this was from approximately 100 to around 200. Unlike their counterparts’, the female students’ number rose considerably between 1970-71 and 1980-81 (from 50 to around 200), and this growth is seen almost arrested between 1980-81 and 1990-91.