You should spend about 20 minutes on this task.
The charts below show the changes in ownership of electrical appliances and amount of time spent doing housework in households in one country between 1920 and 2019.
Summarise the information by selecting and reporting the main features, and make comparisons where relevant.
Write at least 150 words.
CAMBRIDGE 16 Academic WRITING TEST 1
FOR VIDEO EXPLANATION: https://youtu.be/hRab20j8igQ
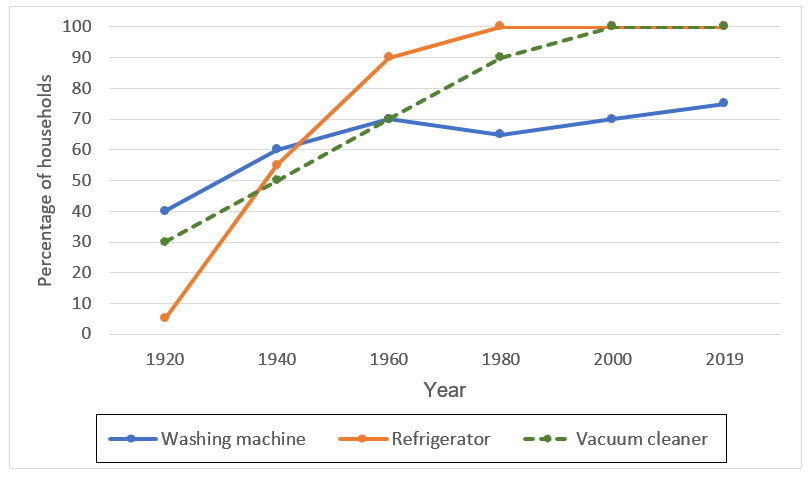
The way which people of a country used three household electrical appliances and how it had its impact in the time they spent doing housework per week between 1920 and 2019 are portrayed in the given line graphs.
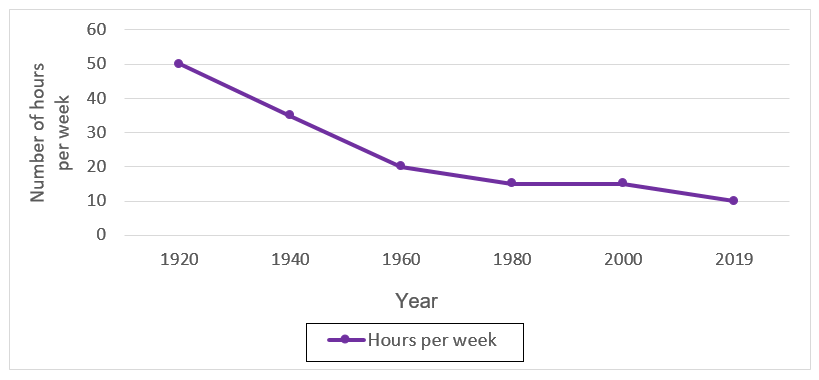
Overall, it is clear that the popularity of these appliances and the duration of time a household spent a week at housework were inversely proportional during the given time period.
As per the first chart, in 1920, washing machine was the most popular gadget among the households. When around two-fifth of the country’s population tried it, the rate of those who used a refrigerator was 10 less. Only a negligible proportion used a vacuum cleaner in the given year. Since then there was a hike in the use of all three gadgets. By 1980, 100% of the country’s households had a refrigerator, whereas it took another 20 years for vacuum cleaner to reach this target. However, the rate of those who used a washing machine had not crossed 65 even by 2019.
Turning to the duration of housework by an average household per week, a sharp decline can be seen between the years. From about 50 hours a week, this declined by one-fifth in 2019.
Word count: 192