


Information on the distribution of water worldwide divided by three sectors and a comparison on the water consumption in two countries in 2000 is illustrated in the given charts.
Overall, it is obvious that the water consumption across the world increased over the given period. It is also noted that in Brazil’s consumption was far higher than Congo’s water consumption.
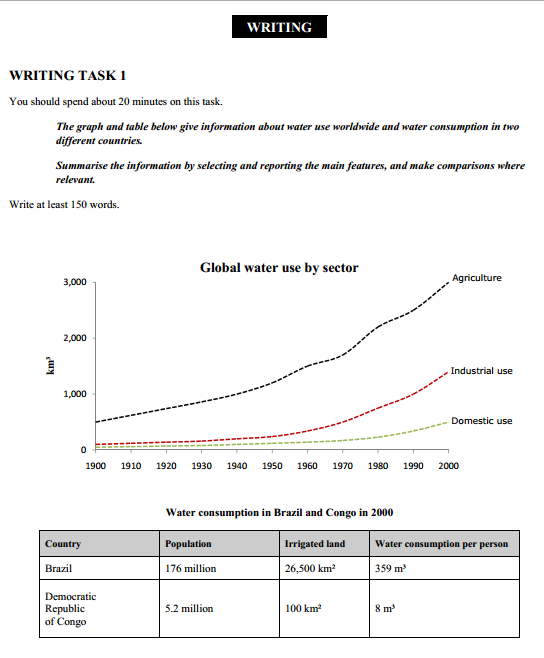
Turning to the table, with 176 million inhabitants, Brazil got 26500 km2 land irrigated, whereas Congo, which had a population of just 5.2 million got 100 km2 of its land irrigated in 2000. It is also noted that the water consumption per person in these two countries in the same year was 359 m3 and 8 m3 respectively.
As per the line graph, the water consumption in all the three sectors: agriculture, industry and household was increasing in the 20th century. Of these three sectors, the demand of water was much higher in the agricultural sector. This was from 500km3 to 1000km3 between 1900 and 1940. Thereafter, the demand started shooting up, and by 2000, it hit a record high of 3000km3. Water consumption in both industrial and domestic sectors was far below this; however, these too swelled in the second half of the century crossing 1000km3 and 300km3 respectively.