You should spend about 20 minutes on this task.
The graph below shows the average class size in six countries and compares it with the world average class size in 2006. Summarise the information by selecting and reporting the main points and give comparisons where relevant.
Write at least 150 words.
FOR VIDEO EXPLANATION: https://youtu.be/brwE3zxtpsA
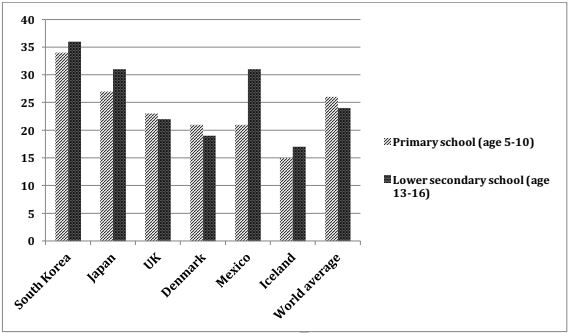
The given bar chart compares the average class size in primary schools and lower secondary schools in six nations with comparison to the world’s average in 2006.
In general, the class size of lower secondary schools was larger, except in the UK and Denmark, and this exception is much similar to the world average.
It is clear from the chart that the class size was larger in both South Korea and Japan. Of the two countries, higher numbers of students were there in South Korea, with 36 and 34 in lower secondary and primary schools respectively, while in Japan, this was 31 and 23. Mexico stood next in case the class size. However, the number of lower secondary students in a class in Mexico was 31, which were 10 higher than those who were in a primary school class.
The class size in the UK and Denmark showed a different pattern, when the number of primary school students was slightly higher. The student occupancy in both countries ranged between 16 and 24, and the higher figures were for the UK. The world average stood at 26 and 24 for primary and lower secondary school students respectively. The least class size was there in Iceland, with an average occupancy of 15.