


You should spend about 20 minutes on this task.
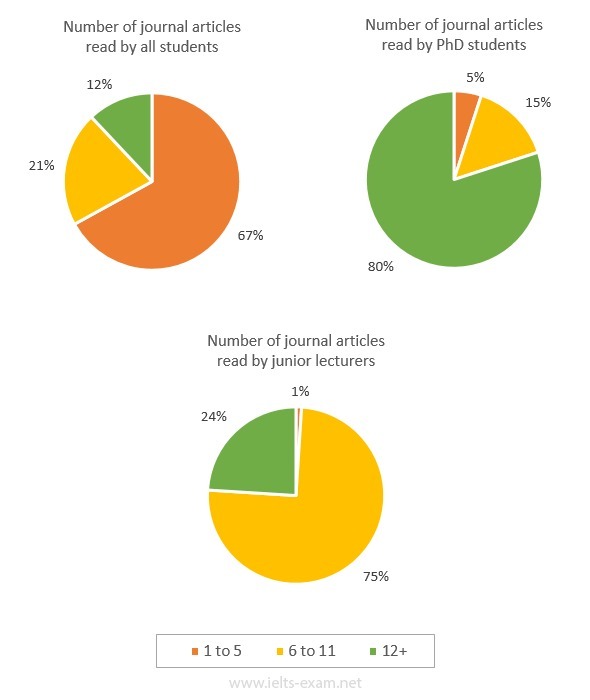
The pie charts below illustrate the number of journal articles read per week by all students, PhD students, and junior lecturers at an Australian university.
Summarise the information by selecting and reporting the main features, and make comparisons where relevant.
Write at least 150 words.
MODEL ANSWER>>>
Information about the journal reading habit of three different groups at an Australian university is portrayed in the given pie charts.
It is clear that the rate of research students had a habit of reading more books than the other two groups.
As per the charts, most Phd students read 12 or more books a week (80%) , whilst this habit was seen only in almost a quarter of the junior lecturers. This rate was seen the least among the other category (12%).
Turning to the proportion of those who read 6 to 11 books, junior lectures stood first. Exactly three-fourth of them had this habit, whereas it was just over a fifth in case of all students. However, only 15% of research students fell in this range.
Most of the students from the first category (all students) had a habit of reading less than 6 books, and this was approximately 67%. This proportion is seen minimal among the other two categories. Among Phd students, it was 5, while among junior lecturers, it was just a percentage.