You should spend about 20 minutes on this task.
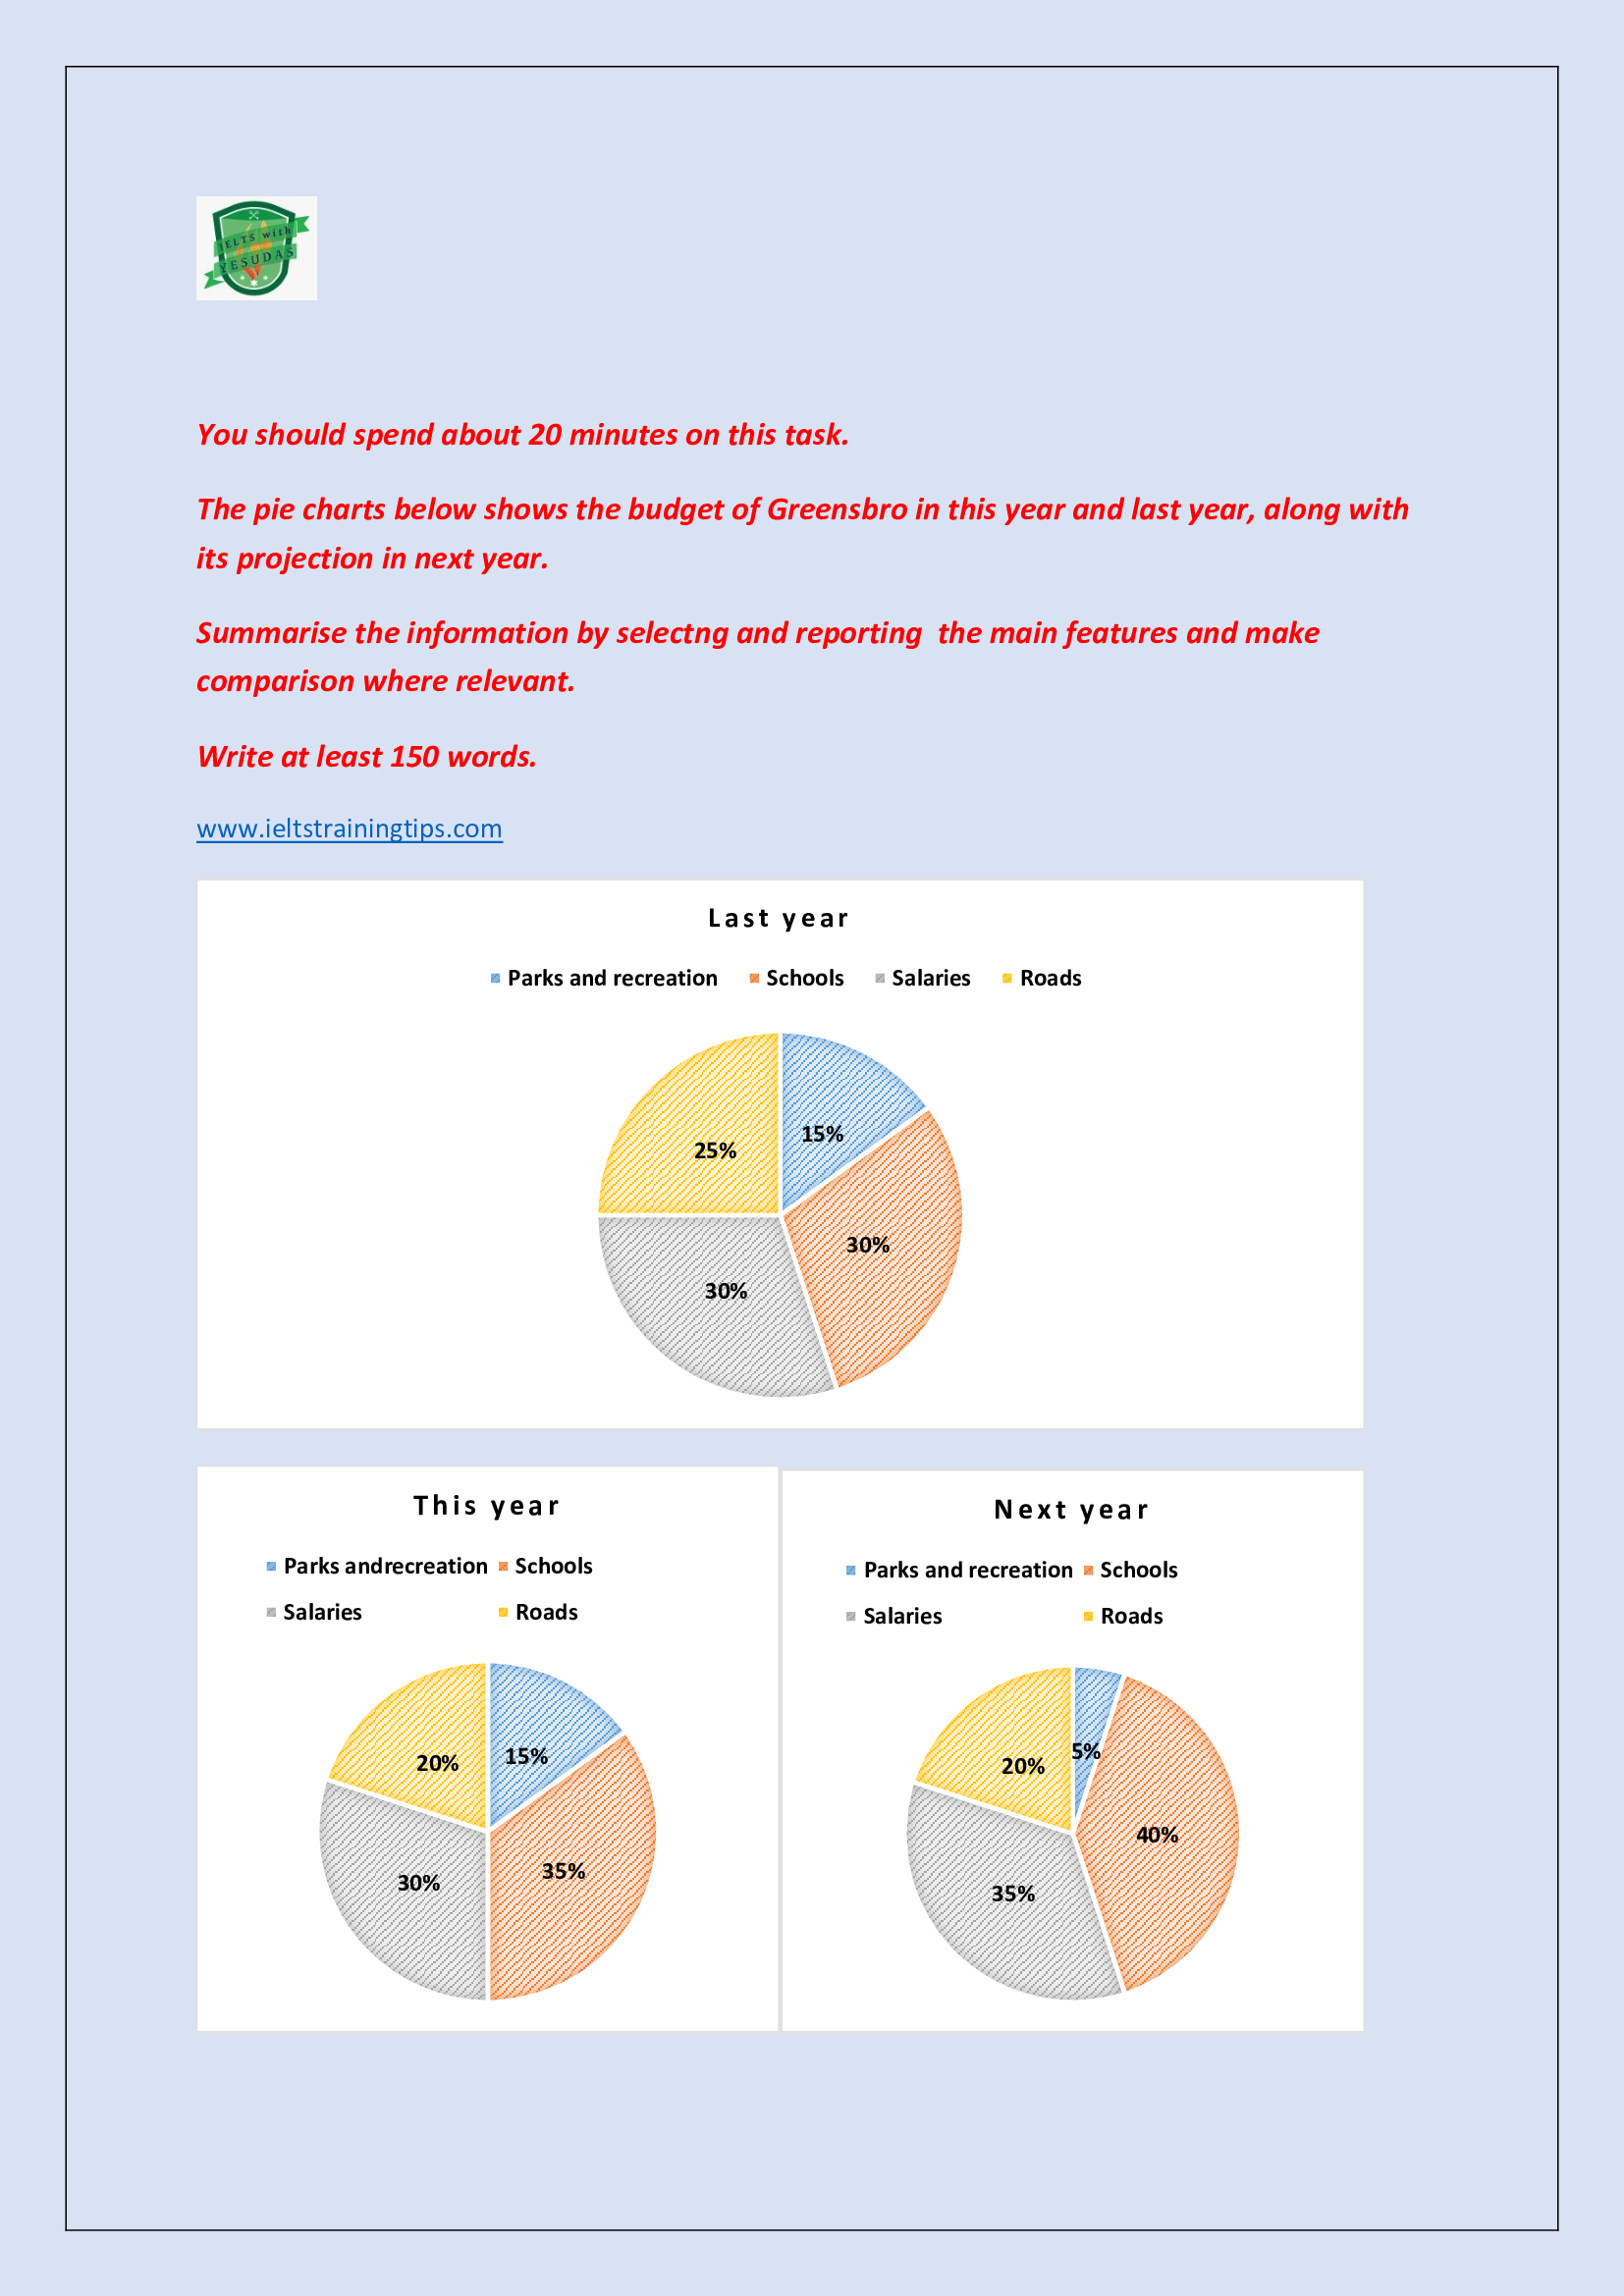
The pie charts below shows the budget of Greensbro in this year and last year, along with its projection in next year.
Summarise the information by selectng and reporting the main features and make comparison where relevant.
Write at least 150 words.
The pie charts give an account of how the current year’s budget allocation differed in the town of Greensboro when compared to the previous year’s, and how it would differ in the next year.
Overall, it is clear that the town is seen concentrated more on educational sector now, and is projected to focus on salaries too in the coming year.
As per the budget allocation at present, the lion’s share is spent on the functioning of schools in the town. This accounts for just above a third of the gross budget (35%). This is exactly 5% more than that of the previous year. This surplus share is seen deviated from the 25%, which was allocated for the development of roads in the last year’s aggregate budget. The budget shares for disbursing salaries and for enhancing the situation of parks and recreation remained the same at 30% and 15% respectively.
When compared to the current year’s budget share allocation, next year is set to witness a hike in the proportion of both salaries and schools, and this would be by 5%. This expected hike would be by deducing the share of parks and recreational development by 10%.
Word count: 190