MODEL ANSWER:
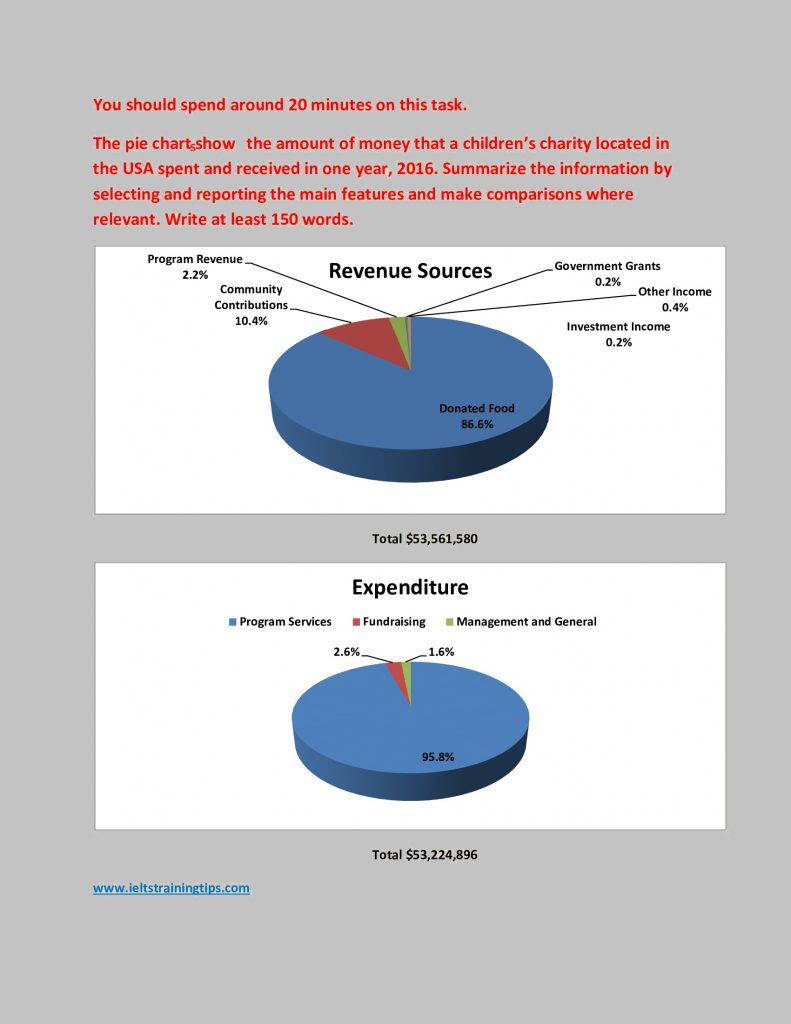
Information on the major sources of income of a charity organization in the USA in 2016 and the way it spent on different areas is portrayed in the given pie charts.
As is visible in the first chart, the lion’s share of the total revenue source of the charity organization came in the form of donated food, and this constituted for 86.6%. Just over a tenth of the inflow of income was received by means of community contributions, and this can be seen as the next major share of revenue. Combined contributions from other areas constituted for just 3%, of which program revenue stood at 2.2%. The rest came from investment income, grants from the government and from other areas.
Turning to the expenditure pattern, almost 99% was spent on program services and fundraising (95.8% and 2.6%), whereas the rest (1.6%) was spent on management and general sectors.
It should be also noted that there was a surplus budget of $336,684 for the organization in 2016.
Overall, it is understood that when the major source of income of the charity was from donated food, the main area it disbursed was to the program services.
Word count: 184