


You should spend about 20 minutes on this task.
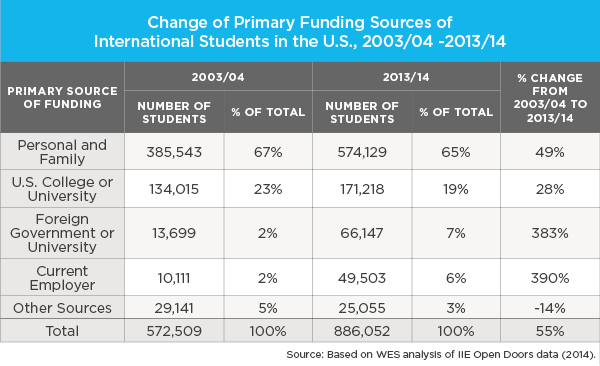
The table below shows the primary funding sources of international students in the US during the years 2003/04 and 2013/14. Summarize the information by selecting and reporting the main features and make comparisons where relevant.
Write at least 150 words.
MODEL ANSWER:
The tabular data represents the basic sources of funding of overseas students in the US between 2003/04 and 2013/14.
In general, it is clear that there were more primary financial assistance for these students between the years, with the aids from foreign governments and current employers exceptional.
In 2003/04, out of the total 572,509 international students, most got their basic financial assistance from their families or by self (67%). When around 23% got their primary funds from their respective colleges or universities in the US, foreign governments or universities and current employers assisted about 2% of them. The rest (5%) got assistance from other sources.
After a decade, when the aggregate number of students climbed to 886,052, the primary sources of their income had not changed much. Approximately 65% were either independent or family depended, while 19% depended on their universities. However, a wide disparity is seen in the rate of this change between the years. The changes, mostly positive, was the highest in case of financial assistance from the current employer at 390%, followed by foreign government or university (383%).
The exception was the negative growth in this rate (-14%) in case of other sources.
Word count: 182