


MODEL ANSWER>>>
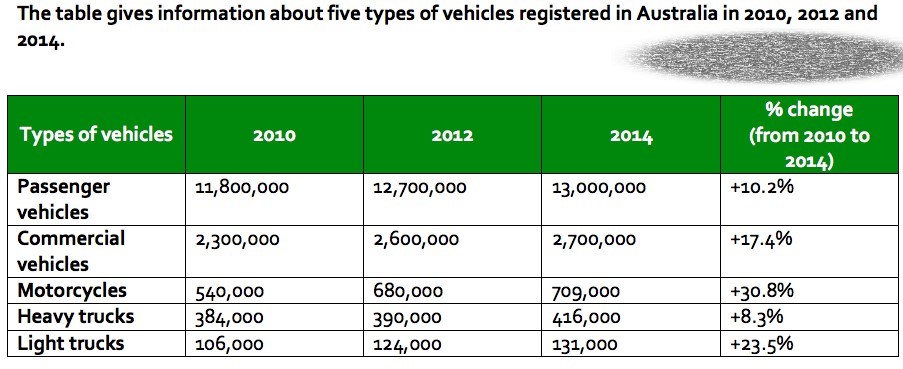
Data regarding the gross number of vehicle registration in Australia divided by five categories in 2010, 2012 and 2014 is depicted in the given table.
At a glance, it is clear that there was an increase in this number over the period, with a higher registration rate for motorcycles.
As per the chart, the highest number of registration was recorded in the category of passenger vehicles in all three years. When 11,800,000 of such vehicles were registered in 2010, its rate grew by 10.2 by 2014. In case of commercial vehicle registration, which stood second in the table, also had added its numbers, but the rate of growth was 7.2 higher when compared to the former.
Exceptional growth was recorded in case of both motorcycles and light trucks in Australia between these years. While in case of motorcycles, this was between 540,000 and 709,000, in case of light trucks, this ranged from 106,000 to 131,000.
The lowest rate of growth in vehicle registration was for heavy trucks between the years (8.3%), but it had 416,000 registrations, which was 285,000 more than the light trucks in 2014.
Word count: 170