


You should spend about 20 minutes on this task.
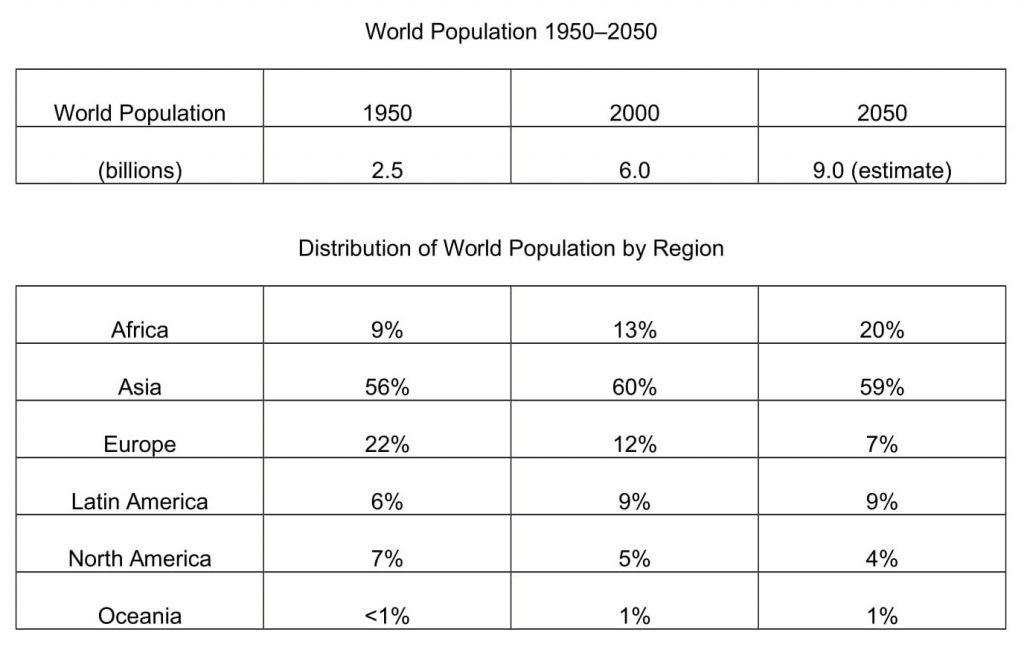
The tables below give the distribution of world population in 1950 and 2000, with an estimate of the situation in 2050.Summarise the information by selecting and reporting the main features, and make comparisons where relevant.
Write at least 150 words.
MODEL ANSWER:
A clear cut comparison on the world population with its regional distribution from 1950 to 2000, and its projection in 2050 are illustrated in the given tables.
Overall, it is clear that the global population is seen increasing over the period, and Africa is the only region where a projected growth is seen.
As per the first table, the hike rate of population across the world was exceptional between 1950 and 2000, when it grew more than double in 2000 (6 billion) when compared to 1950 (2.5 billion). However, the projected growth is seen slowed down till 2050, when it is expected to hit 9 billion.
Out of the 2.5 billion population in 1950, 56% were Asians, which was the highest, and this grew by 4% in 2000. The rate, however is set to slip by 1% by 2050. Europe, the second in the list in 1950 (22%), had shrunk its population size by 10% in 50 years and is expected to shrink further by another 5%. A declining trend is also seen in case of North America (7 to 4%), whereas in Latin America and Oceania, it is expected to stabilize at 9 and 1% respectively.
The only exception is Africa, where the population is predicted to swell to 20% in 2050 from just 9% in 1950, and would settle as the second most populated region, behind Asia.