


MODEL ANSWER:
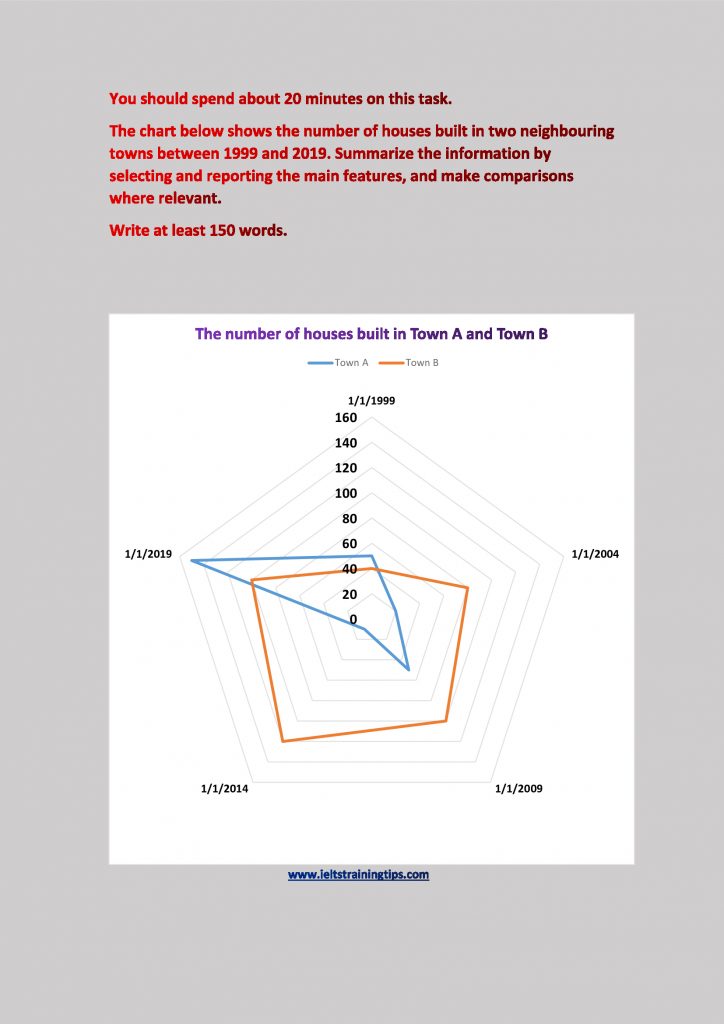
Information on the volume of houses constructed in two adjacent towns between 1999 and 2019 is depicted in the given chart.
In a nutshell, more number of houses was built in Town B than in Town A during this period.
In 1 January 1999, out of the total 90 houses constructed, 50 were in Town A. The total number of constructions stood the same after five years (1/1/2004), however, the volume of completed houses in Town B doubled (80). As the gross number of houses built in both towns swelled to 150 in 2009, the ratio of construction stood at 1:2 (50 in Town A and 100 in Town B).
The trend had a difference in 2014, when there was a decline in the construction numbers by 20 from 150. The year also witnessed the completion of the least number of houses in Town A (10). The year 2019 was exceptional when an aggregate of 250 houses were built, of which 150 were in Town A.