You should spend about 20 minutes on this task.
The line graph below shows the household recycling rates in three different countries between 2005 and 2015.
Summarise the information by selecting and reporting the main features and make comparisons where relevant.
Write at least 150 words.
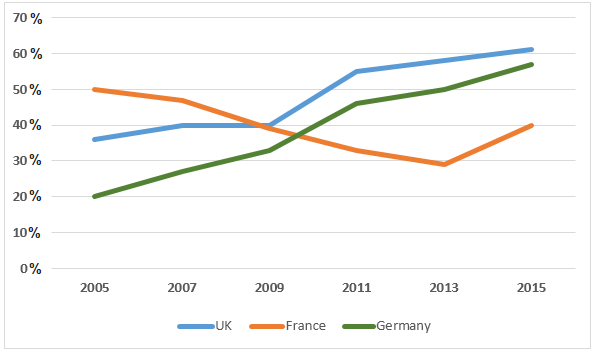
Variations in the proportion of domestic wastes recycled by three countries from 2005 to 2015 are illustrated in the given line graph.
Overall, it is clear that unlike France, the pattern of recycling was positive and similar in case of the UK and Germany.
As per the chart, household recycling was more popular in France than in the UK and Germany in 2005. When half of the total domestic waste was recycled in France, Germany could recycle only a fifth (20%), which was almost 15% less than that of the wastes recycled in the UK.
In 2009, the rate of recycling in the UK surpassed the rate of France’s, crossing the 40% mark. Germany too could increase the recycling rate to just over 30% by this year.
Between 2009 and 2011, the proportion of household recycling in both the UK and Germany climbed sharply to reach 55% and 45% respectively. From then, both the countries’ rate started converging to almost 60% by 2015. Despite a constant fall in the proportion of domestic waste recycling, France started showing its inclination towards the process between 2013 and 2015, with a 10% hike from 30%.
Word count: 174