


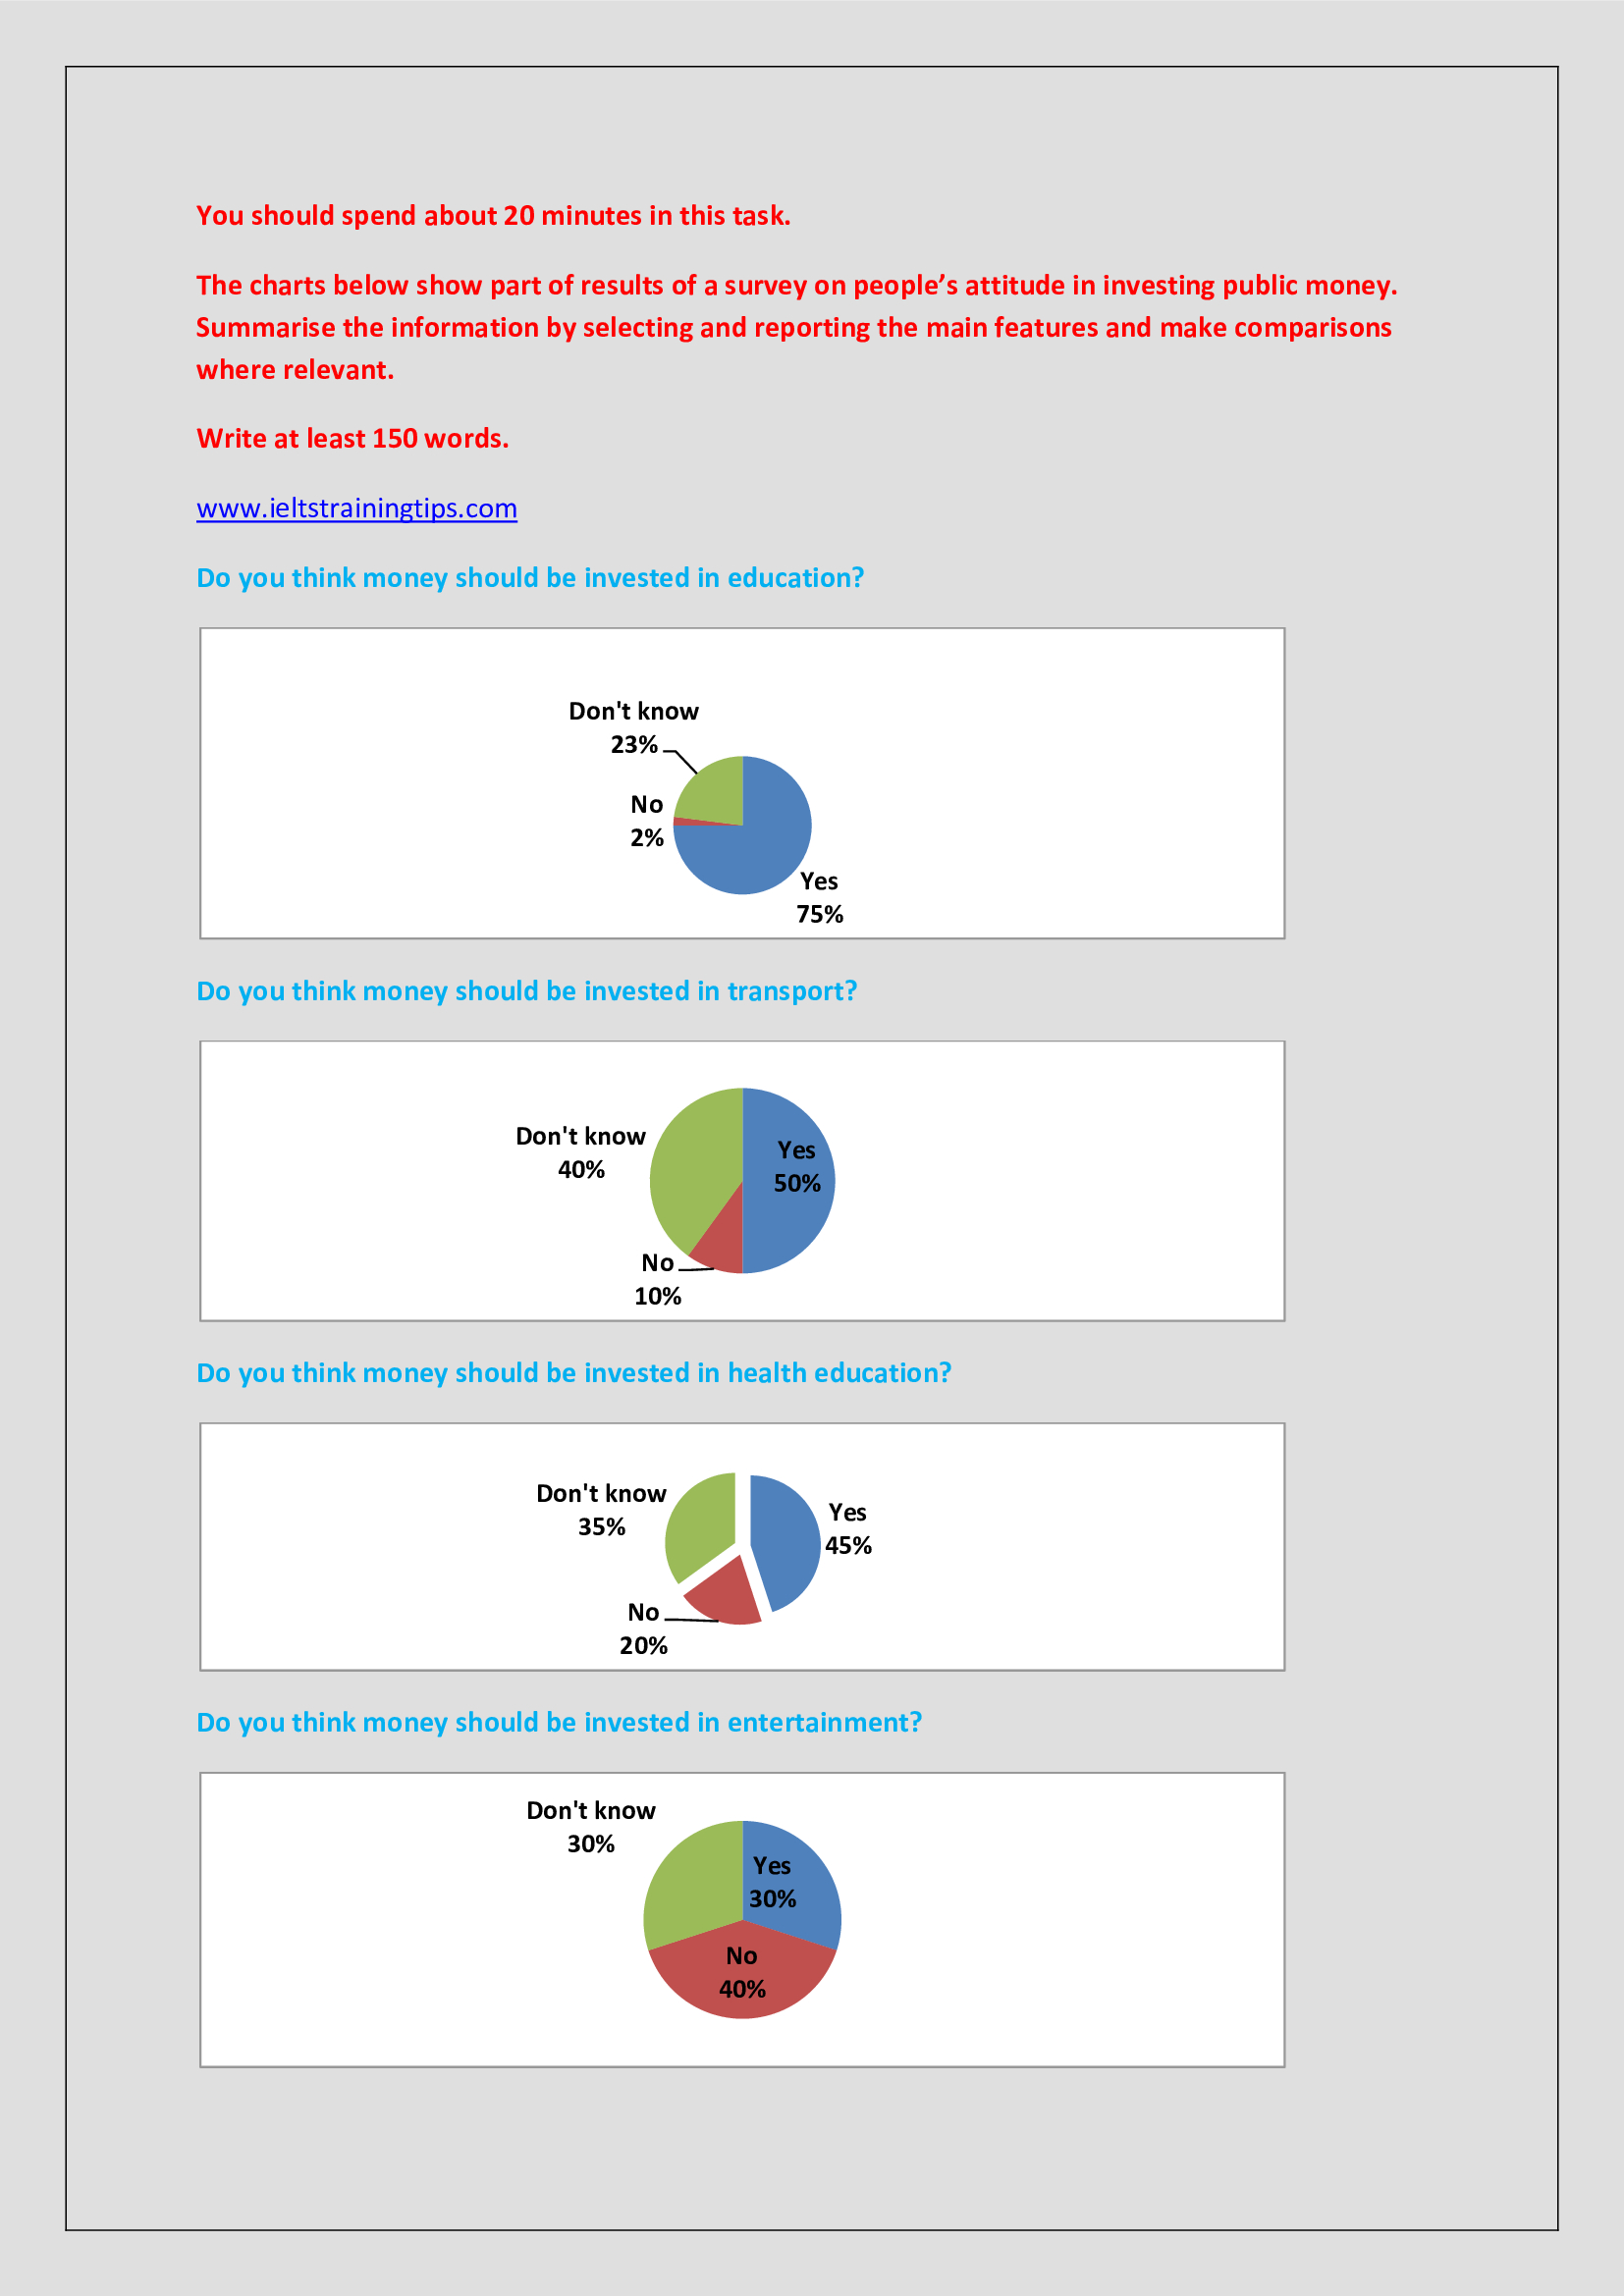
The way in which the attitudes of people varied on public spending in four different sectors is depicted in the given pie charts.
Overall, it is clear that most people responded positively in spending money, except in the sector of entertainment.
In case of fund allocation in the field of education, the lion’s share of the respondents expressed their positive consent. This accounted for exactly three-fourth of the total, whereas just 2% expressed their disapproval.
Turning to the response in the spending on transportation sector, exactly half reported that it is a good idea. It is surprising to note that two-fifth of the total respondents have not made their opinion clear, whereas the rest responded negatively.
Regarding the disbursement of money in providing health education, despite a mixed response, over two-fifth (45%) marked their willingness. When 35% had no opinion, the rest showed their discontent.
It is interesting to note that most people had not responded positively in spending money on entertainment. This accounted for exactly 40%, 10% more than those who expressed the other two responses.
Word count:172