


MODEL ANSWER:
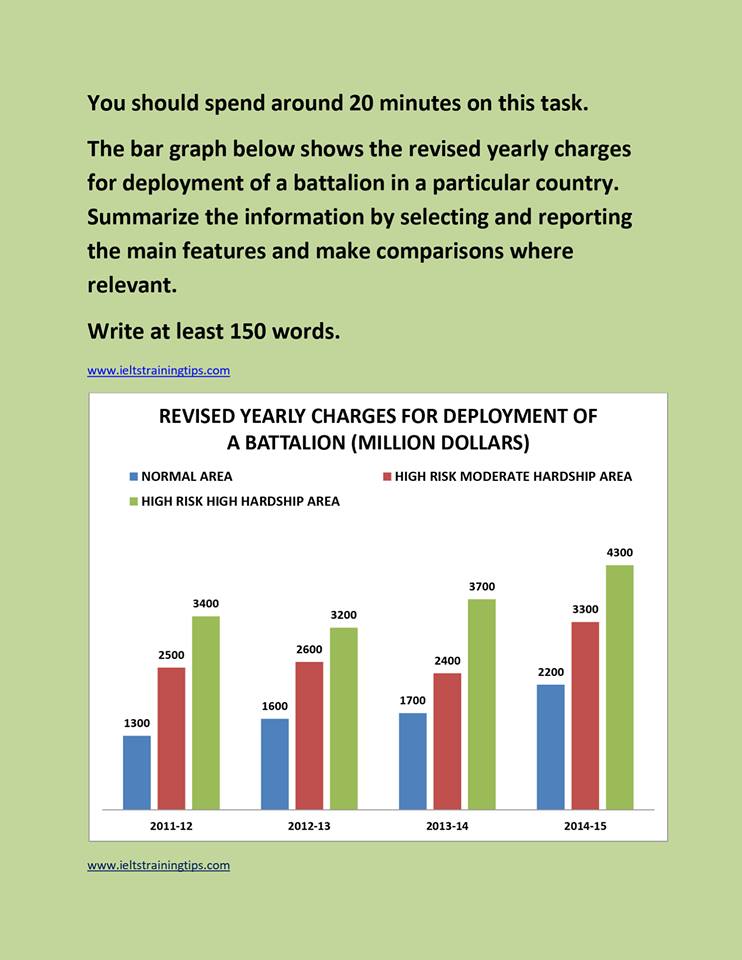
Information on the revised for a battalions deployment in three levels of areas in a country from 2011-12 to 2014-2015 is elucidated in the given bar chart.
As per the bar chart the disbursement is seen increasing over the period with some exceptions. In 2011-12 the highest spending at the High Risk High Hardship area($3400 million)which was 900 more than High Risk Moderate Hardship Area and 2100 more than normal areas. In the consecutive year the charges for High Risk High Hardship area fell by $200 million whereas spending on high risk moderate areas and normal areas rose by 100 and 300 respectively.
A different pattern can be observed in the subsequent year when the allocation of fund to the High Risk Moderate Hardship areas fell by $ 200 million. At the same time it was $3700 million in High Risk High Hardship area which was 2000 more than the normal areas. In the final year of the period, the spending stood at the maximum for all three areas, Off which $4300 million was the highest which was spent on High Risk High Hardship areas.
Overall, it is clear that charges for battalion deployment had an exceptional increase in all three regions over the period.