MODEL ANSWER:
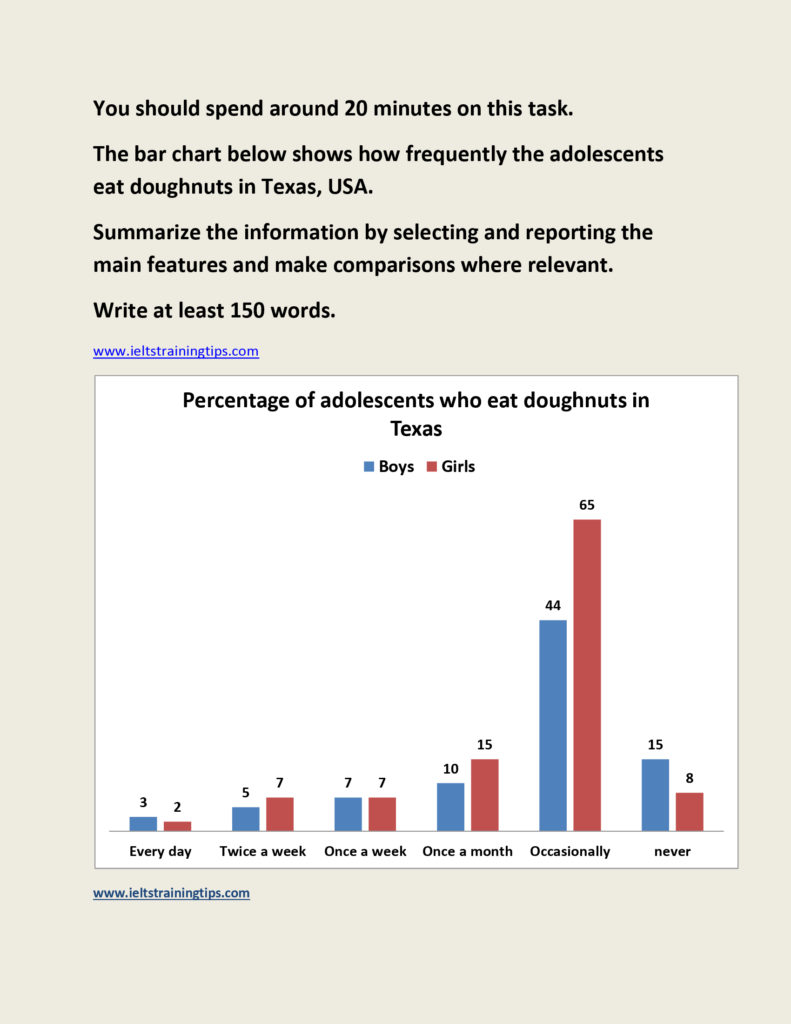
The frequency of doughnut consumption by teenagers in Texas in the USA is depicted in the given bar chart.
As per the graph, girls consume doughnuts more frequently than boys in the city of Texas. When 15 per cent of boys have never tasted a single doughnut, the proportion of girls who has the same experience is nearly its half. The proportion of occasional doughnut consumers among adolescents is comparatively higher in the city. This accounts for 65 % and 44 % respectively. Around one-tenth of the teenage boys in Texas eats doughnuts once a month, which is 5% less than their female counterparts. When the disparity is 2% in case of twice a week consumption, the rates are exactly the same in case of weekly consumption(7%). However, the pattern is different in case of everyday consumption, when the teenage boys in Texas have a slight upper hand over the girls(1%).
Overall, it is clear that as the frequency widens, the proportion of doughnut consumption also widens among the adolescents in Texas.
Word count:165