MODEL ANSWER:
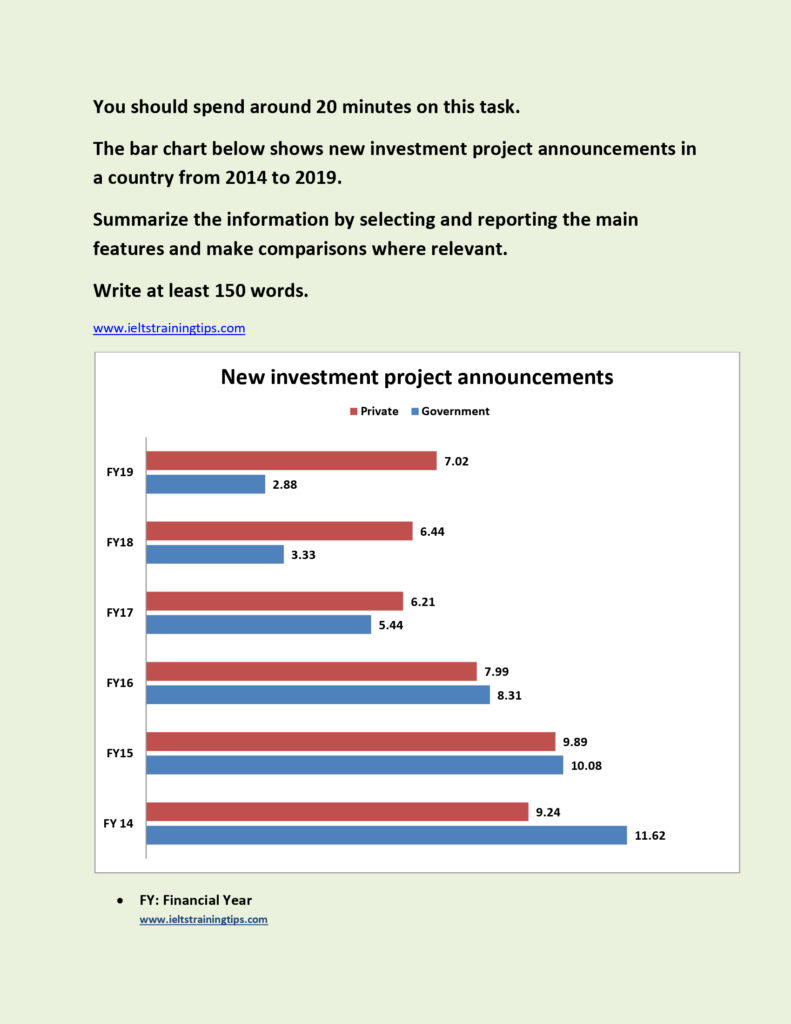
A country’s new investment project announcements by both public and private sectors over a span of six consecutive financial years from 2014 are depicted in the given bar graph.
As per the chart, the share of new state investment project announcements is seen declining throughout this period, whereas the private sector’s share is seen more or less stable. In the financial year 2014, when the former’s share was 11.62%, the latter’s was 2.38% less. Though the state still had a slight upper hand in its new investment announcements in the two succeeding financial years, the gap between the two sectors (Private and government) became narrow (0.19 and 0.32% respectively). However, the trend is seen reversed in the next three fiscal years (including the current year), when the private sectors made more new investment announcements. When the disparity between the shares of the two sectors grew from 0.77% to 4.14%, the growth of private shares in new investment announcements was just 0.81%.
Overall, it is clear that the rate of new investment project announcements by both the sectors was almost inverse in nature over the given period.
Word count: 177