 MODEL ANSWER:
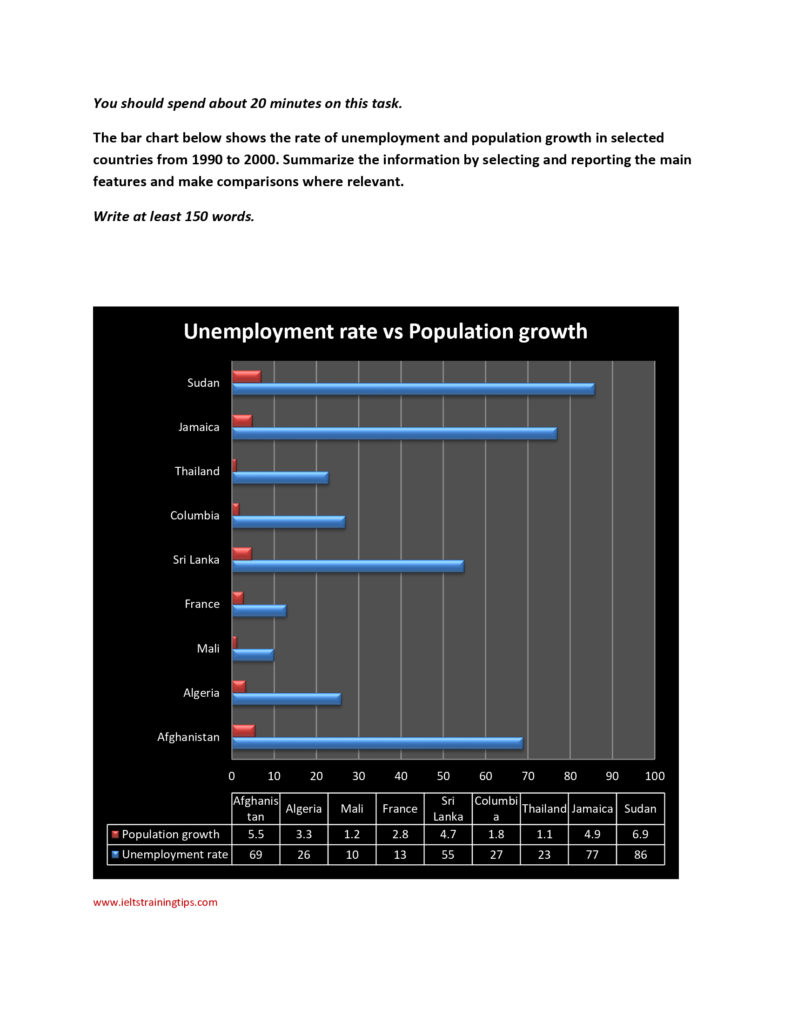
A comparison between the rates of unemployment among people in nine countries and their growth in population from 1990 to 2000 is depicted in the given bar diagram.
As can be seen from the chart, out of the nine, the unemployment rate was significantly high in four countries, namely Sudan, Afghanistan, Jamaica and Sri Lanka. This rate ranged from 55 in Sri Lanka to 86 in Sudan, whereas the average rate was 73 in the other two countries. The average population growth in these four countries was also comparatively higher than the other (5.5%). This growth was slower in Algeria and France (3%) and in the other three counties, it hardly crossed 2%. However, a reverse pattern is seen in case of the unemployment rates of these five countries. Despite the higher growth rate in population, Algeria and France could manage a lower unemployment rate when compared to Thailand, Columbia and Mali. In Algeria, it was 26, whereas in France, it was only its half.
Overall, it is clear from the chart that in case of managing the unemployment rate, France performed well ahead of all the other countries over the given period.
(Word count: 181)
Note: It is recommended to give the examiner the impression that you have understood the task in the complete sense by presenting comparisons in an attractive way.